17 Most Important Digital Marketing Metrics Every Business Should Track
In order to harness the power of digital marketing metrics, marketers must first understand what they are and how they're used. Here's a guide that explains the top 17 digital marketing metrics you need to know.

What comes to your mind when you think about digital marketing metrics? Is it Google Analytics?
Indeed, Google Analytics gives us a lot of insight into what we’re doing. This tool can provide you with a huge amount of information and insight about your website. However, you also need a broader picture of how your marketing campaign is doing.
With so many metrics available, it’s easy to lose sight of what digital marketing is really all about: improving ROI. A metric that directly correlates to business success can help you make smart business decisions.
Metrics that measure sales, leads, and traffic are the ones that matter most in digital marketing. These marketing metrics can come from your website, social media, and email, but some will come from your web content.
What are digital marketing metrics?
A digital marketing metric is how marketers track, measure, and record progress. Metrics themselves are varied and can differ from platform to platform.
While there are many metrics you could keep track of, you need to focus on what matters for your campaign.
There are thousands of additional marketing metrics you can use to describe your campaigns. Nevertheless, we’ve grouped them into 17 categories that we think are most useful for measuring campaign performance. (More about this below)

What’s the difference between metrics and KPIs?
While some people confuse the two terms, others use them interchangeably.
However, KPIs or Key Performance Indicators are key measures that have a massive impact on the success of a company.
Metrics, on the other hand, are measures of “business as usual”. Metrics add value to an organization but aren’t a standard that must be met.
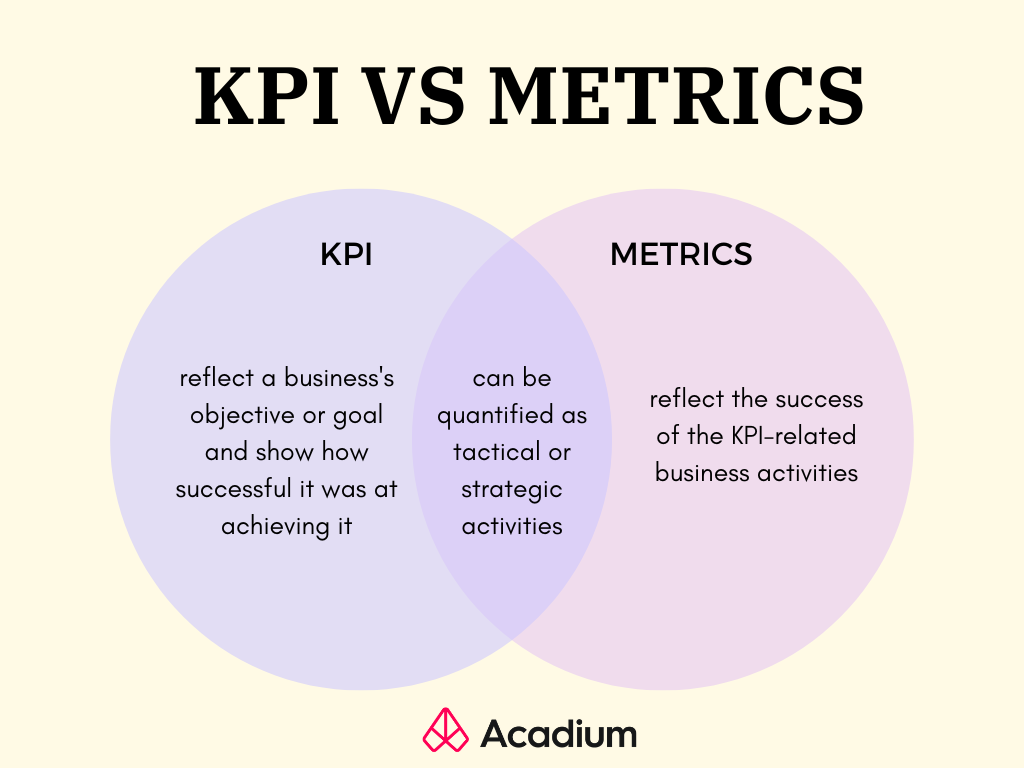
But both can be quantified as tactical or strategic activities.
KPIs reflect a business’s objective or goal and show how successful it was at achieving it. Metrics, however, reflect the success of the KPI-related business activities.
Ultimately, digital marketing metrics and KPIs tell an organization how well it is doing, so comparisons between them have equal importance.
Types of Digital Marketing Metrics
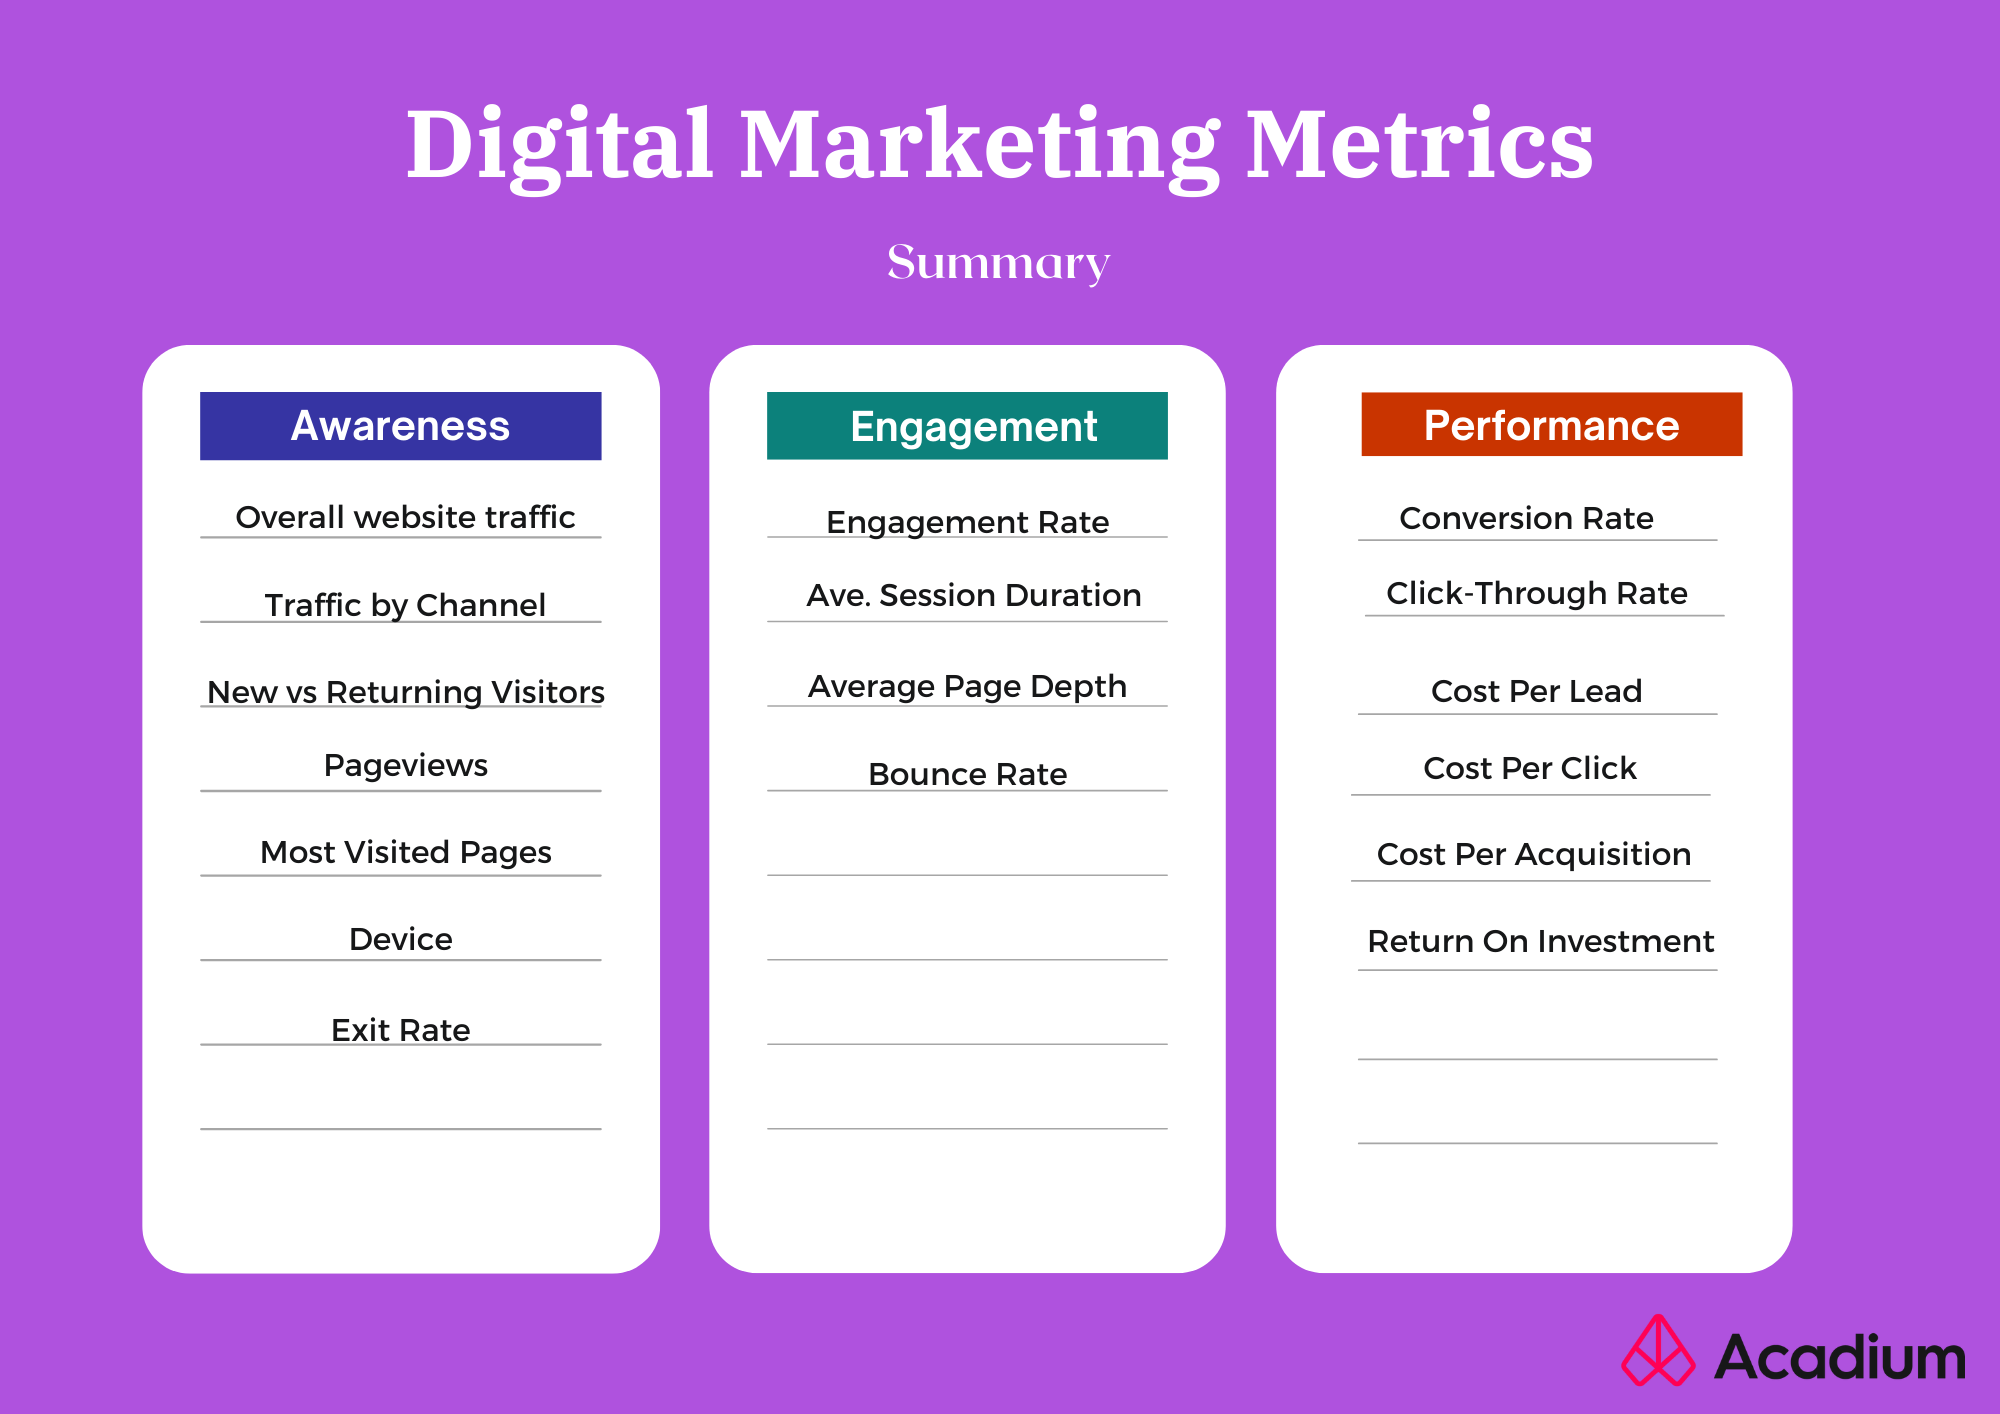
The metrics you use to measure your success will vary depending on the types of digital marketing campaigns you use. Here, we have categorized digital marketing metrics according to the marketing activities they describe. These include:
- Awareness –Typically, these metrics track what happens when your business comes in contact with a lead for the first time, typically through a paid ad, a field event, or organic search engine results.
- Engagement – These metrics show what happens after first contact. The engagement metrics measure how often and quickly top-funnel leads are converted into qualified leads and ultimately into sales.
- Performance – These metrics measure marketing success in dollars and cents. By comparing costs and results, performance metrics track the return on investment (ROI) of marketing campaigns.
Note that there are metrics here that belong to more than one category.
For example, click-through rate (CTR) is a metric found under Digital Advertising Metrics, but it can also be used in B2B marketing, website engagement metrics, and email marketing.
While context changes, the fundamental definition of a click-through rate remains the same. Therefore, it only appears on our list once.
17 key digital marketing metrics you should track
It is important to remember that every business is unique – it has its own goals and objectives. B2B businesses, for example, may focus on generating leads, while E-commerce stores focus on transactions. Because of this, you will have to define your own digital marketing metrics.
Unfortunately, there is no template that fits every situation. Therefore, we’ve highlighted a few of the most important types of digital marketing metrics to help you define the best ones for your future campaigns:
Awareness Metrics
1. Overall website traffic
What is it:
Website traffic refers to the number of users who visit a website. Traffic is measured through visits, which are sometimes called “sessions,” and is a common way to gauge the effectiveness of online businesses in attracting customers.
Why does this metric matter:
The amount of traffic on your website impacts your business. Basically, the more visitors your website has, the better!
But not all website traffic is good traffic, so you should focus on increasing the quality of your website traffic. At some point, bad traffic can bog down your business.
The more traffic you get, along with the quality of visitors, the better chance you have of getting those visitors to become paying customers.
How to measure it:
For measuring your website’s performance, Google Analytics is a good starting point. All you have to do is place the Google Analytics code on your website to start tracking.
This program will tell you almost everything you need to know and allows you to create custom reports. As we proceed through this article, we’ll be using Google Analytics more frequently.
Other paid options include Kissmetrics, which measures website engagement, Hubspot, which is a marketing automation tool with a single dashboard, and Crazy Egg, which allows you to measure certain types of user behavior.
2. Traffic by Channel
What is it:
A channel is a high-level category in Google Analytics that depicts how people access your website.
While the Source/Medium Report gives you more information about where visitors come from, Channel Analytics in Google Analytics gives you a high-level overview of your website traffic.
Note that there is a difference between the traffic source and the traffic channel.
Traffic sources come from search engines, news websites, advertising emails, and direct visits (when users type in the website URL and visit it).
A traffic channel consists of:
- organic — visitors who find your site through search engines.
- CPC — when people click links in ads and sponsored listings.
- referral — users who come to your website from another website by clicking on a link.
- email — when your email contains links that users click on.
- direct — traffic that comes directly from a user typing in a website’s address in the URL bar.
Why does this metric matter:
In addition to knowing your total traffic, you need to figure out where your visitors are coming from.
For your marketing strategy to work, you’ve got to use a variety of channels with each monitored separately. So, segment the traffic sources and figure out which ones are relevant.
For example, if few of your visitors arrive via organic search, this means your SEO approach may need to be improved.
Monitoring the traffic you receive from various channels will help you determine where your audience comes from, and which channels are the most valuable. In this case, you can allocate more resources to this channel so that your website traffic is maximized.
Using the best SEO strategies is essential for running a successful business. Investing in a professional yet affordable SEO agency is the best way for a business to maximize its benefits from SEO. Not only does it save you money, but it also produces better results.
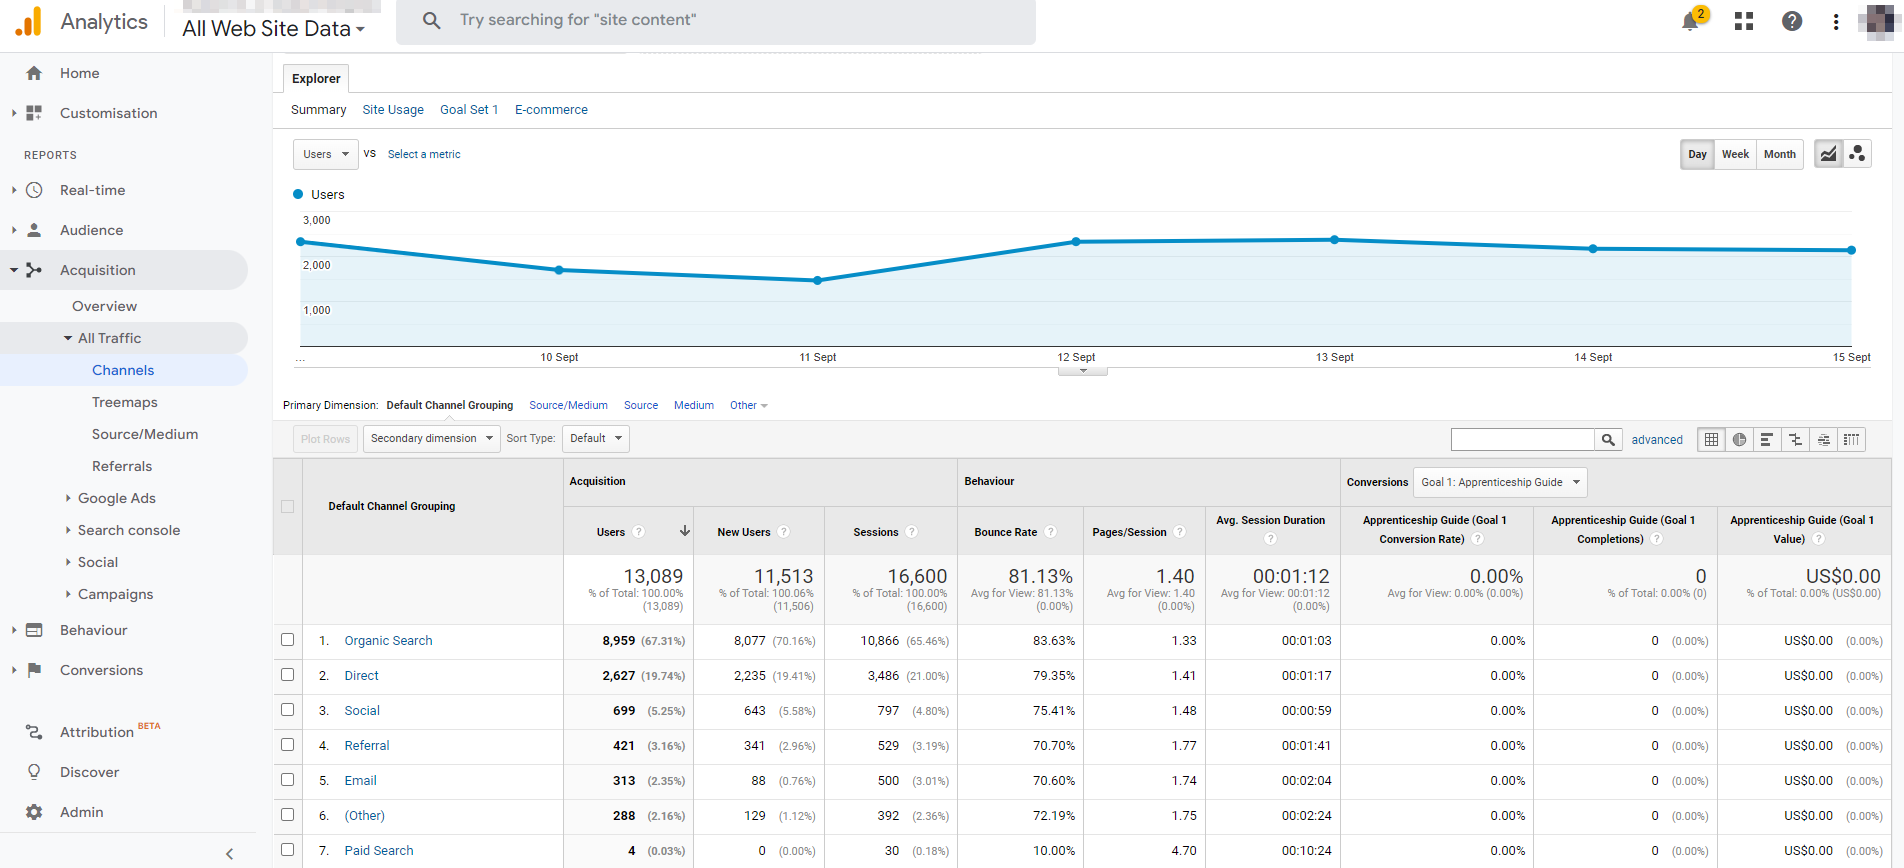
How to measure it:
With the new Google Analytics 4, you’ll be able to track your website’s traffic and engagement in a variety of ways. You may find that Universal Analytics traffic reports look different in Google Analytics 4.
In Universal Analytics, you can find out where all your traffic is coming from by navigating Acquisition > Overview.
For Google Analytics 4, go to Acquisition > Traffic Acquisition to view traffic channels.
3. New vs returning visitors
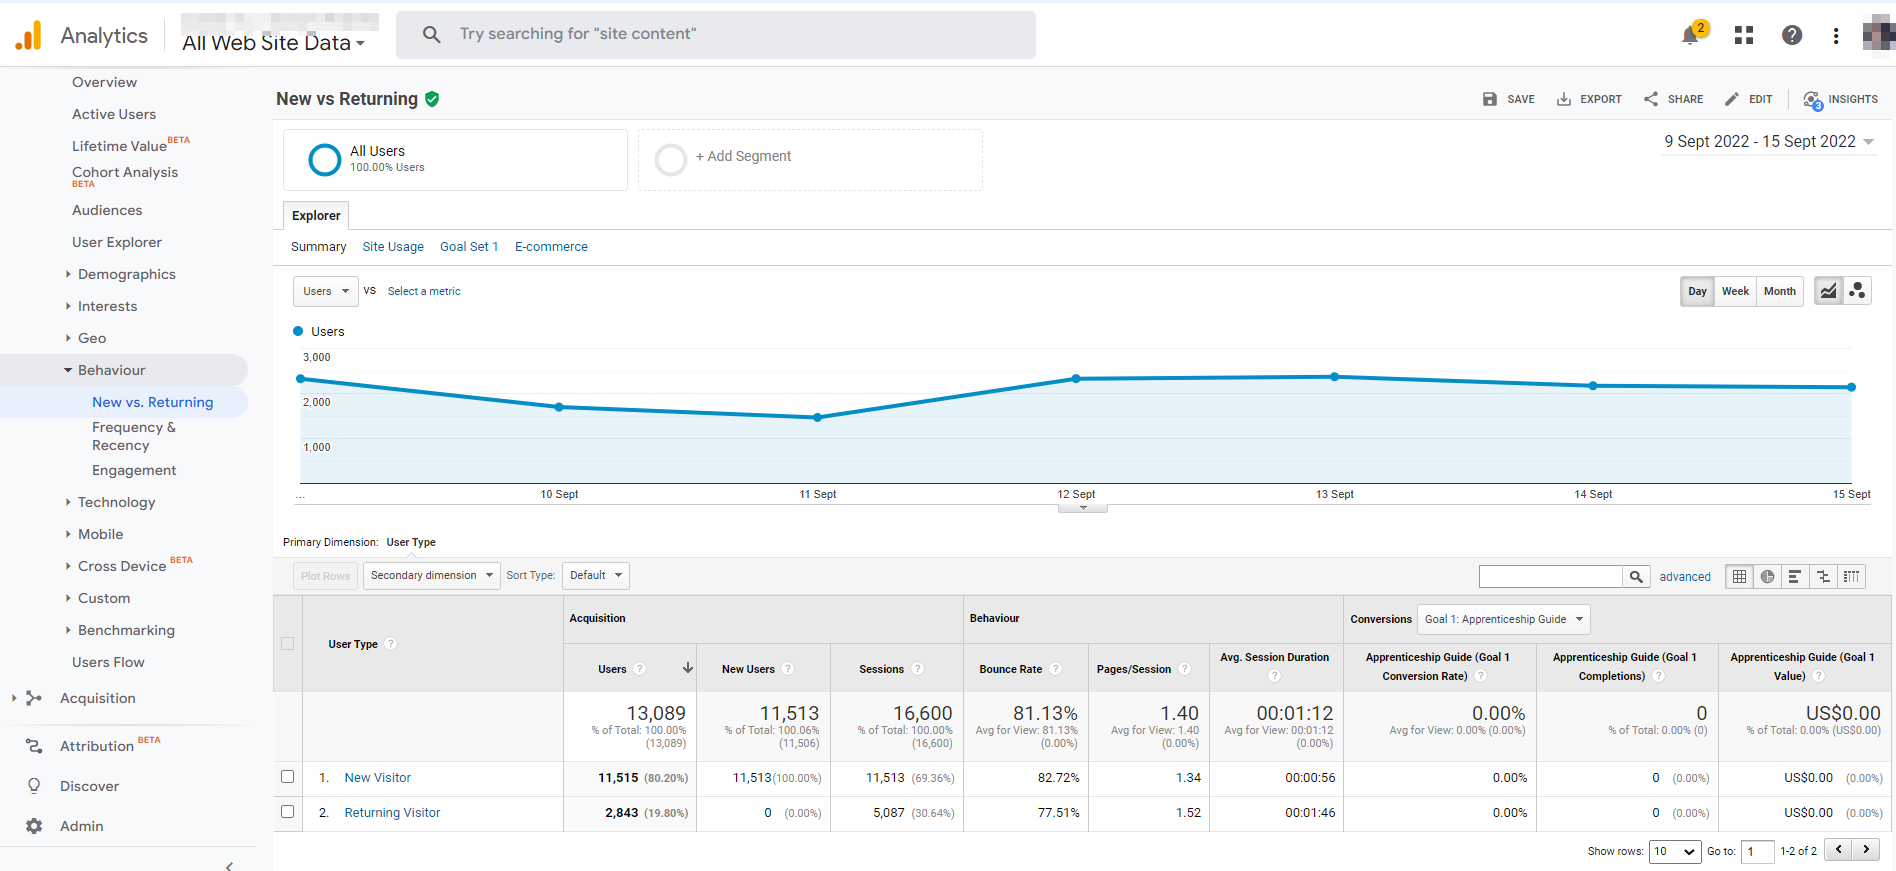
What is it:
New visitors are individuals who are visiting your website for the first time using a device.
In contrast, returning visitors are people who come back to your site more than once, based on Google’s tracking snippet.
Databox reports that returning visitors number could be lower than the actual number of repeat visitors since there are many use cases where returning visitors could be “accidentally” classified as new visitors in Google Analytics.
Why does this metric matter:
By tracking the behavior of returning visitors, you can discover why users convert on subsequent visits and improve conversion rates. Generally, returning users spend more time onsite than new users.
The ratio of new visitors to returning visitors is also an indicator of the effectiveness of your website’s inbound marketing efforts.
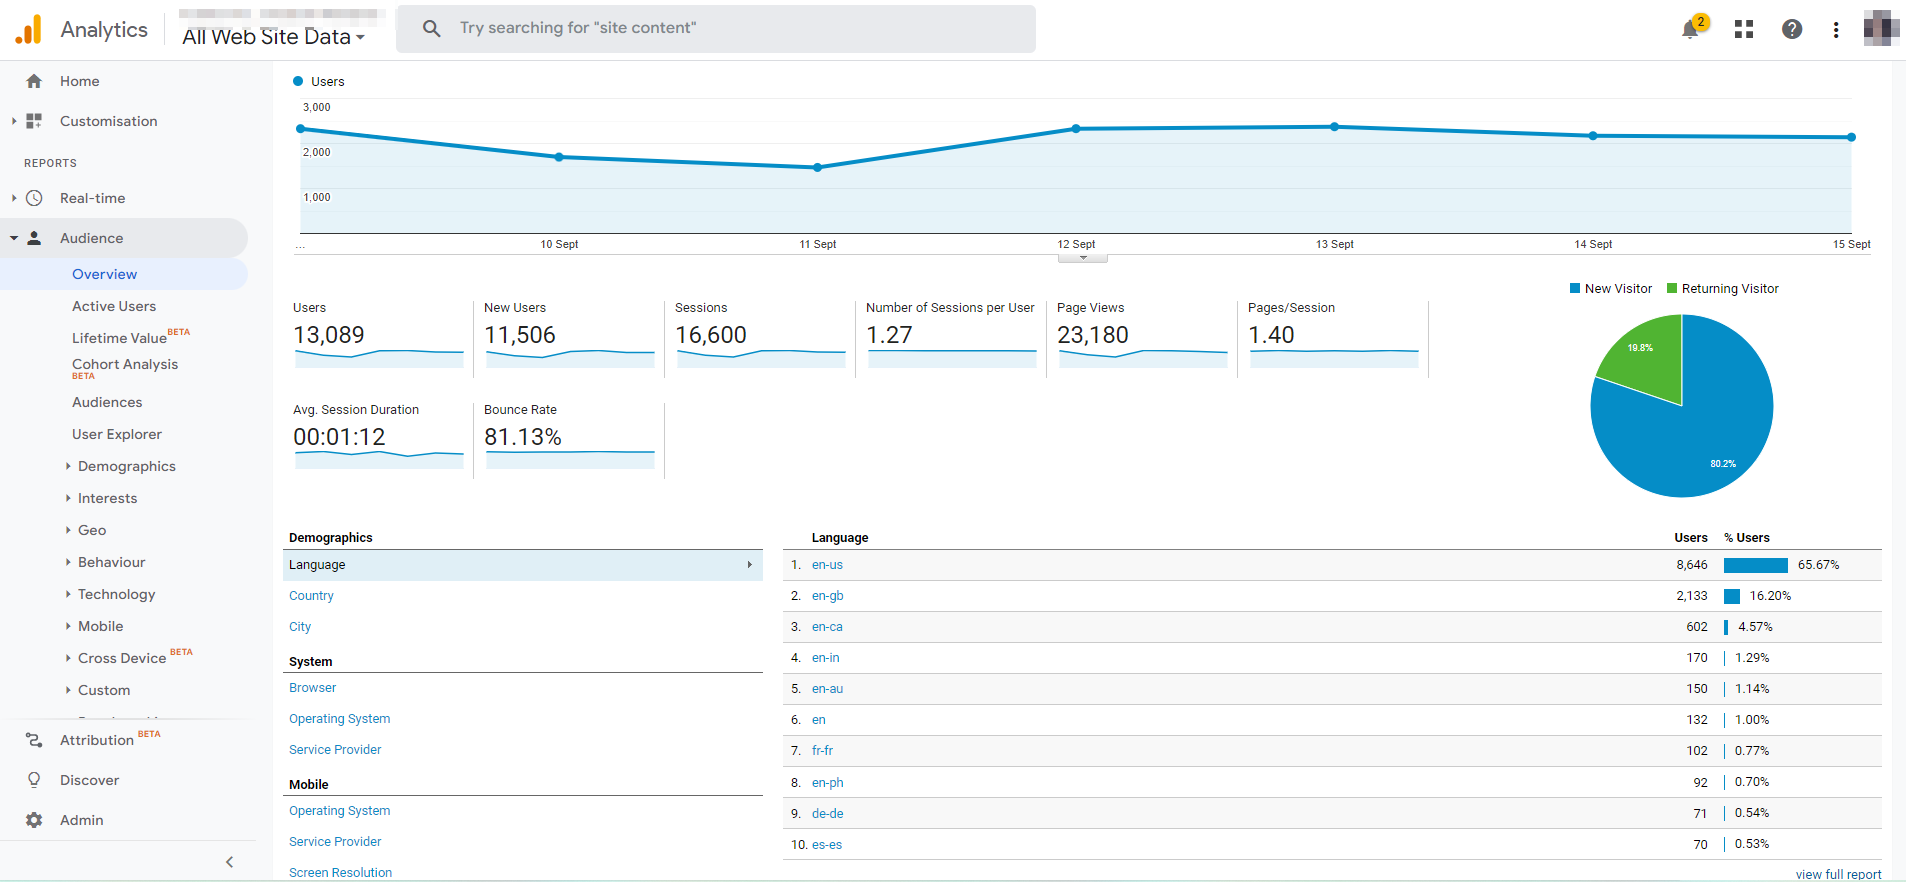
How to measure it:
Use this path to navigate this metric on Google Analytics:
Audience > Behavior> New vs. Returning
In Google Analytics, the dimension User Type is used to distinguish between new and returning visitors.
According to Google, you can use this report to assess your site’s gravitational pull and how well you’re encouraging repeat visitors. The economic impact of new users versus returning users can also be seen.
On average, a good returning visitor rate is 30%, depending on the industry. Ideally, it is best to have 50% of new visitors and 50% of returning visitors.
4. Page views
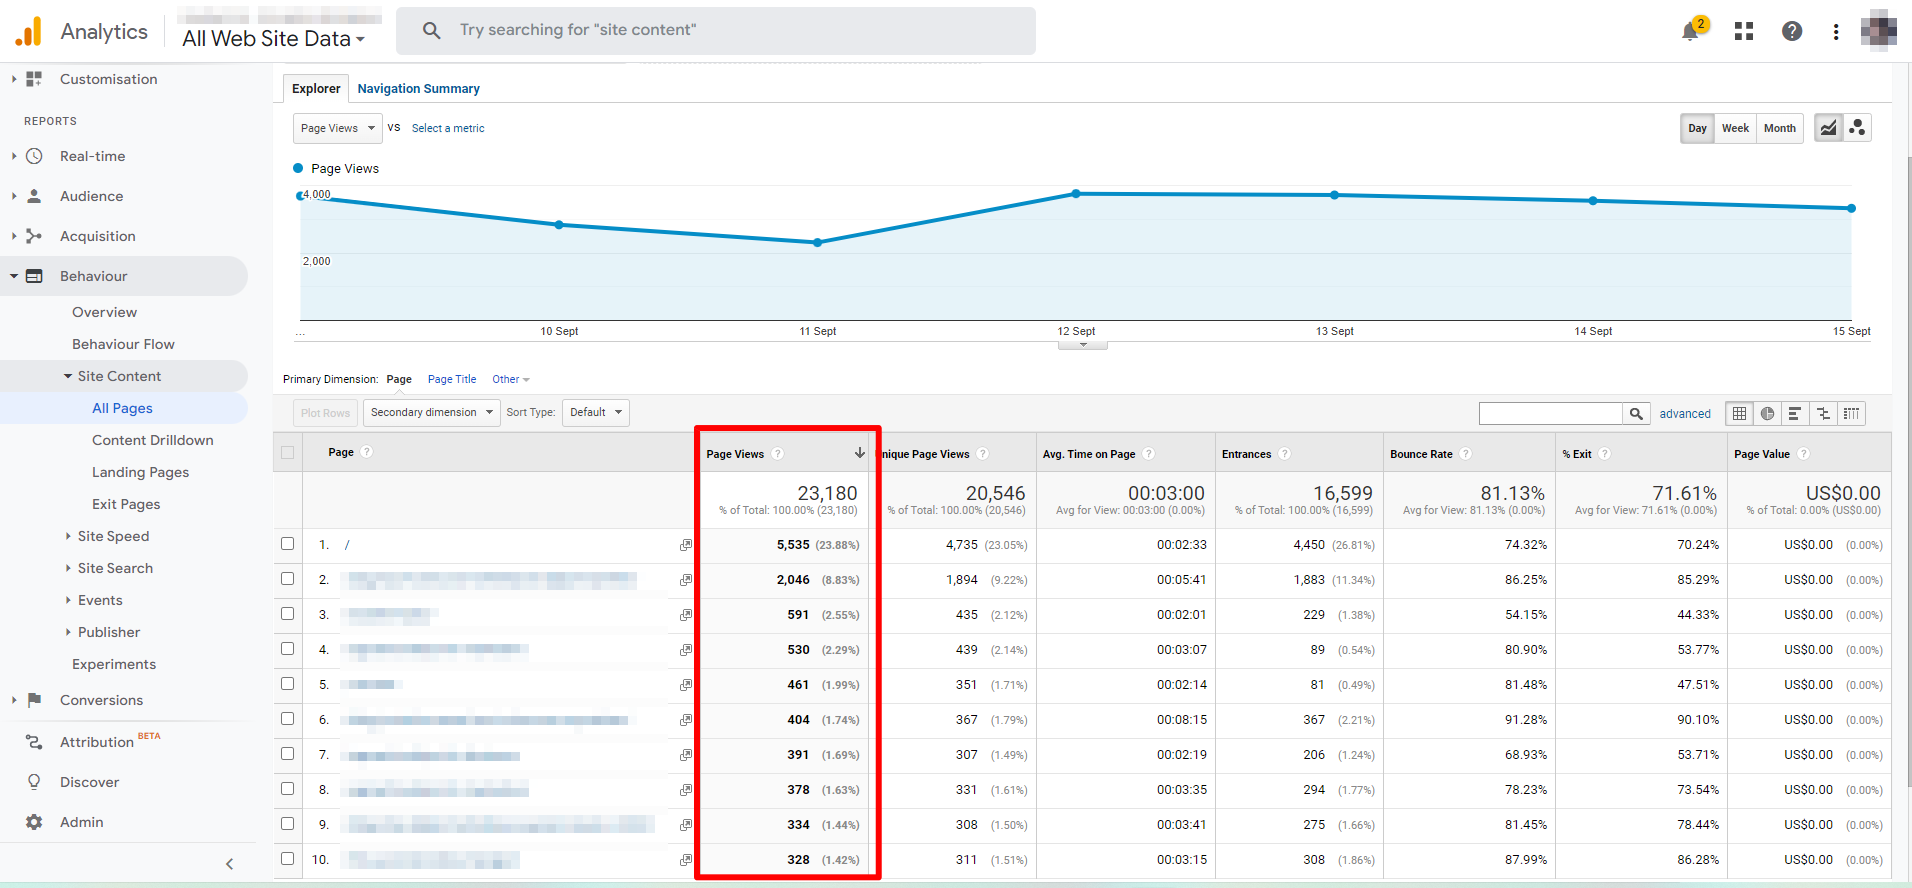
What is it:
As defined by Google, a pageview is “the act of loading a webpage (or reloading it) in a web browser”. A page view occurs every time someone opens and views one of your web pages (regardless of whether they are loading or reloading them).
Why does this metric matter:
Pageviews provide insight into which content users find the most accessible or interesting based on how many views you received on each page. Note that getting more pageviews does not always translate into more users.
The pageview counts for each ad impression on a page, so for publishers, pageviews are important for ad campaigns. Especially if you sell ads for cost-per-thousand views (CPM), this is a big deal.
How to measure it:
For determining the average page view, use the formula below:
Average Page Views per Visit= Page Views / Total Visits
A good number of monthly pageviews depends on a lot of factors and industries.
5. Most visited pages
What is it:
With the Most Visited Pages metric, you’ll be able to discover exactly where your site’s visitors are going and how long they spend on your site.
Why does this metric matter:
Your website is visited by people every day (hopefully!). It’s usually either they’re researching a topic (informational visit) or they’re deciding whether to buy your product (transactional visit).
By knowing which pages people are visiting on your site, you can determine their stage in the Customer Journey (Awareness, Interest, Desire, Action).
Additionally, you may gain insight into the kinds of questions and problems they are trying to solve.
How to measure it:
The following is the menu path on Google Analytics where you can see the most visited pages on your website:
Behavior > Site Content > All pages
6. Device
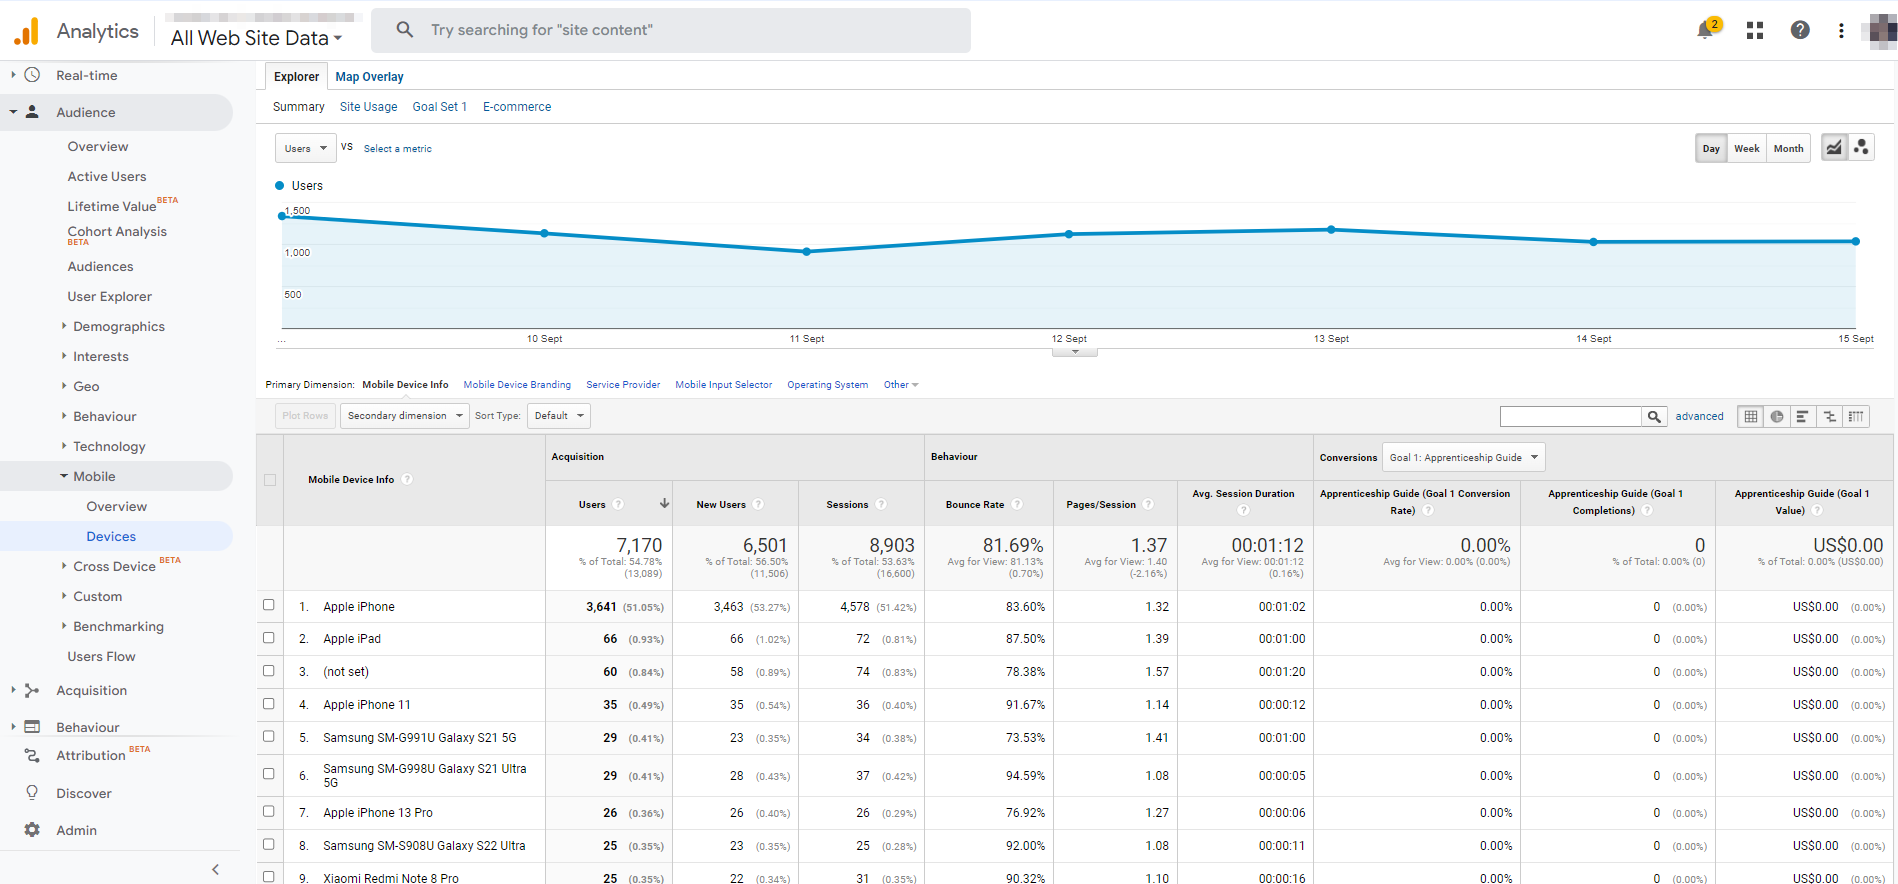
What is it:
Google defines the device category as:
“a browser-based or mobile-app-based identifier for an anonymous website or mobile app user. On a website, the device ID gets its value from the client ID property of the _ga cookie.”
In simple terms, Google Analytics’ Device Category report allows you to see what devices your visitors are using in order to browse your website.
Why does this metric matter:
Identifying the browsers and devices your website is accessed from can help you focus your testing on the devices and browsers your customers actually use.
Today, the ability to display a consistent experience across platforms and devices is crucial for web and software development.
Having device-specific data is also important since people browse the internet via a wide variety of devices, such as smartphones, tablets, and more.
In a recent report by Statista, 48% of people ranked smartphones as their favorite device for accessing the internet.
In the same vein, SmartInsights reported that mobile users spent almost twice as much time online as desktop users.
How to measure it:
On Google Analytics, you can use this path to see how many of your users are on mobile devices:
Audience > Mobile > Overview (or Devices)
During this process, it’s important to make sure your pages are mobile-friendly in order to improve user experience and decrease exit rates.
Calculate the percentage of visitors who use a mobile device to evaluate your strategy.
In addition, try to understand what devices and browsers are used and what types of content are most popular among mobile users.
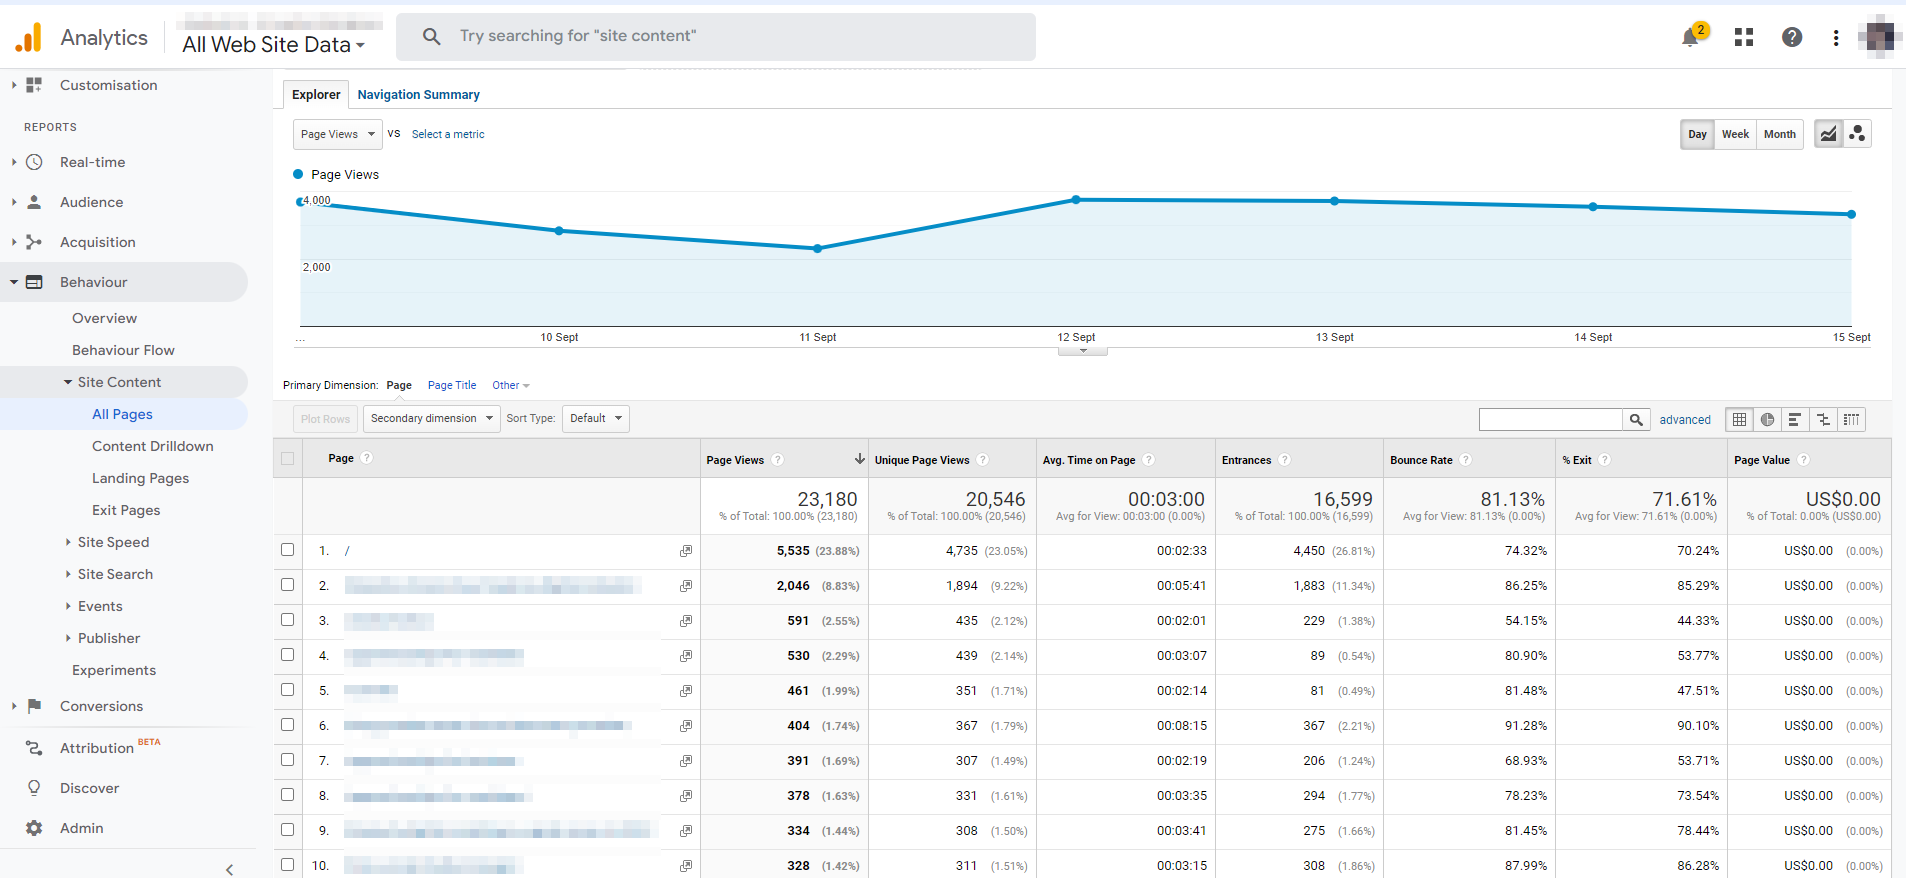
7. Exit rate
What is it:
An exit rate is a metric that measures how often visitors leave a single page on a site.
For example, an e-commerce visitor lands on the homepage navigates to a category page, then a product page, and leaves. That’s an exit from a product page.
Why does this metric matter:
Exits make it easier for you to understand how individual pages and/or page groups are performing: once you know which pages are exited the most, and at the highest percentage, you can discover which pages need to be improved.
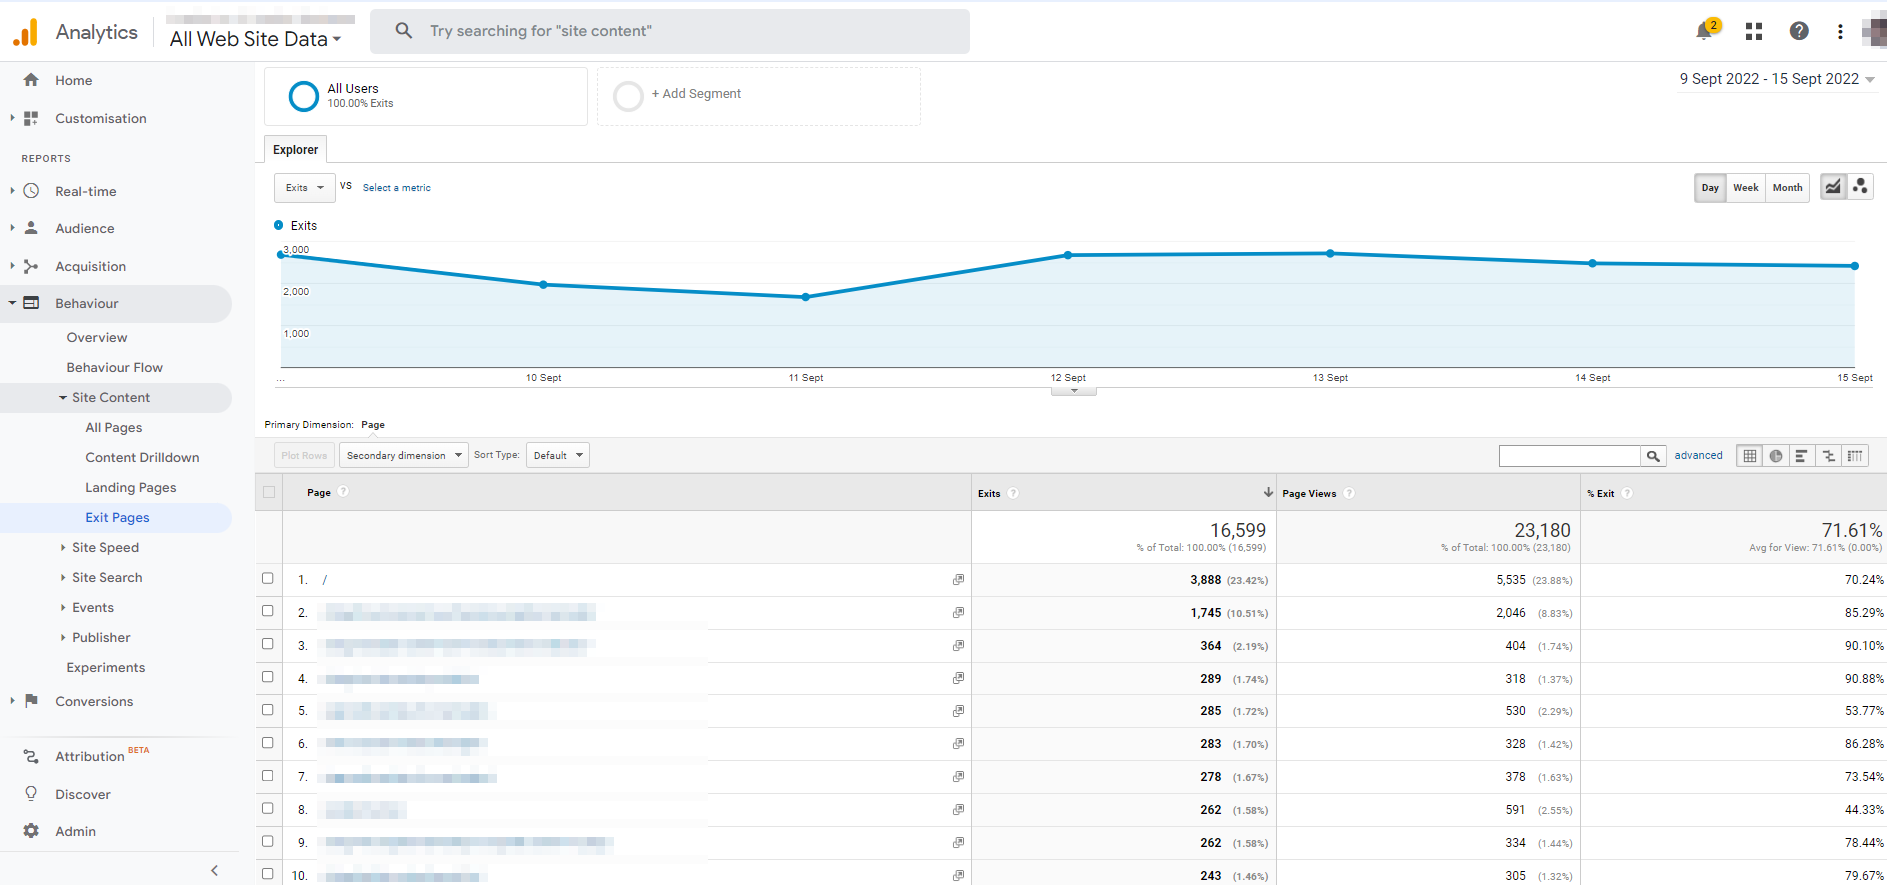
How to measure it:
In percentage terms, the exit rate is calculated as follows:
Exit Rate = Number of Exits / Number of Pageviews for a Particular Page
If you want to see the GA exit rate, follow this pattern:
Behavior > Site Content > All Pages and check the % Exit for each page
An excellent exit rate ranges from 26% to 40%, according to Simple Machines Marketing. The average is between 41 and 55%. The above average is 56% to 70%. Beyond 70% is high (except for blogs, news, and events pages, which tend to see more bounces).
Engagement Metrics
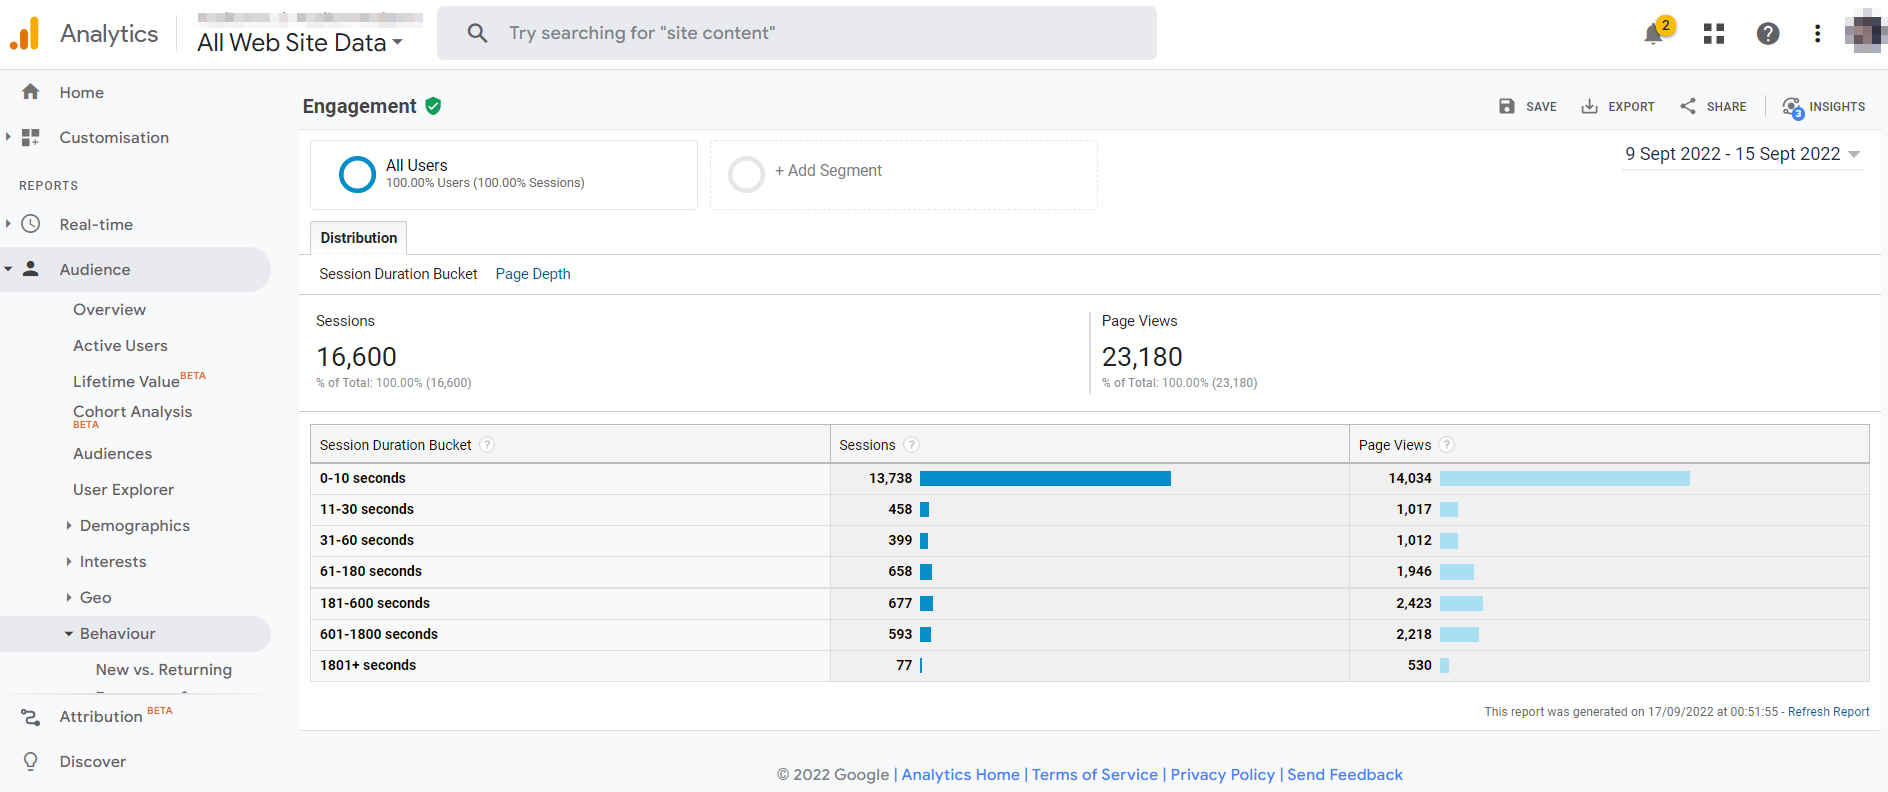
8. Engagement rate
Source: Data Driven
What is it:
The engagement rate tells you a lot about the quality of your website’s visitors. You can find out how long visitors stay on the page or app, as well as if they interact with it.
While engagement rate is probably the most important engagement metric, there are a number of other metrics worth considering.
As a whole, these metrics give you an overview of how your website or app is engaging and reaching users. (More below)
Why does this metric matter:
The importance of engaging users cannot be overstated. GA4’s Engagement Rate helps you understand how to better engage with users of your website or app.
With engagement rate, you are also able to get a true understanding of how successful your digital marketing campaigns are.
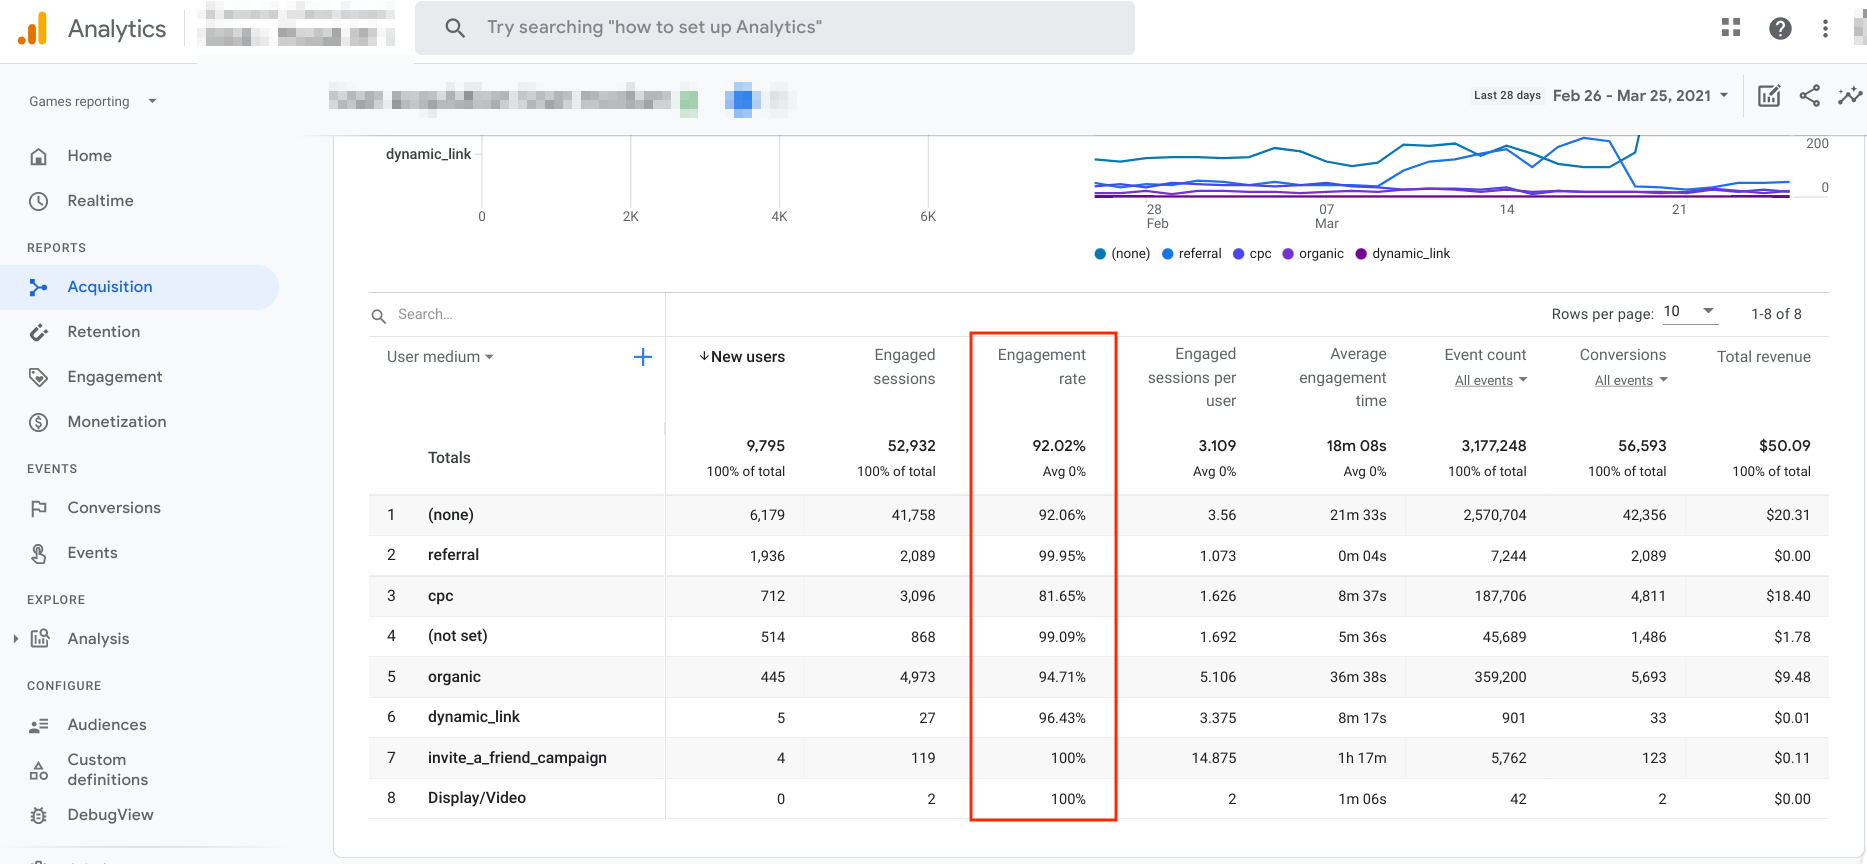
How to measure it:
The engagement rate is calculated using this formula:
Engagement Rate = (Engaged Sessions/ Total Sessions) x 100
The best way to understand this formula is to define engaged sessions.
According to Google, an engaged session occurs when a visitor or user does any of the following:
- Continually visited the page for 10 seconds or more (the time can be easily changed under the admin area)
- At least two pages were viewed
- At least one conversion event was triggered
Whenever a visitor engages in any of the above, their visit is considered engaged.
When you use Google Analytics, all this is handled automatically, so you don’t have to calculate it yourself.
9. Bounce rate
What is it:
A bounce rate is defined as the percentage of visitors who leave a page without taking any action, such as clicking a link, filling out a form, or making a purchase.
Why does this metric matter:
There are three main reasons why bounce rate is important:
The person who bounces from your site (obviously) did not convert. By stopping visitors from bouncing, you can also boost conversions.
Google Ranking factors may include bounce rate.
According to one industry study, Bounce Rate is closely related to first-page Google rankings.
Your website’s bounce rate tells you whether there are issues with content, user experience, page layout, or copywriting on your website.
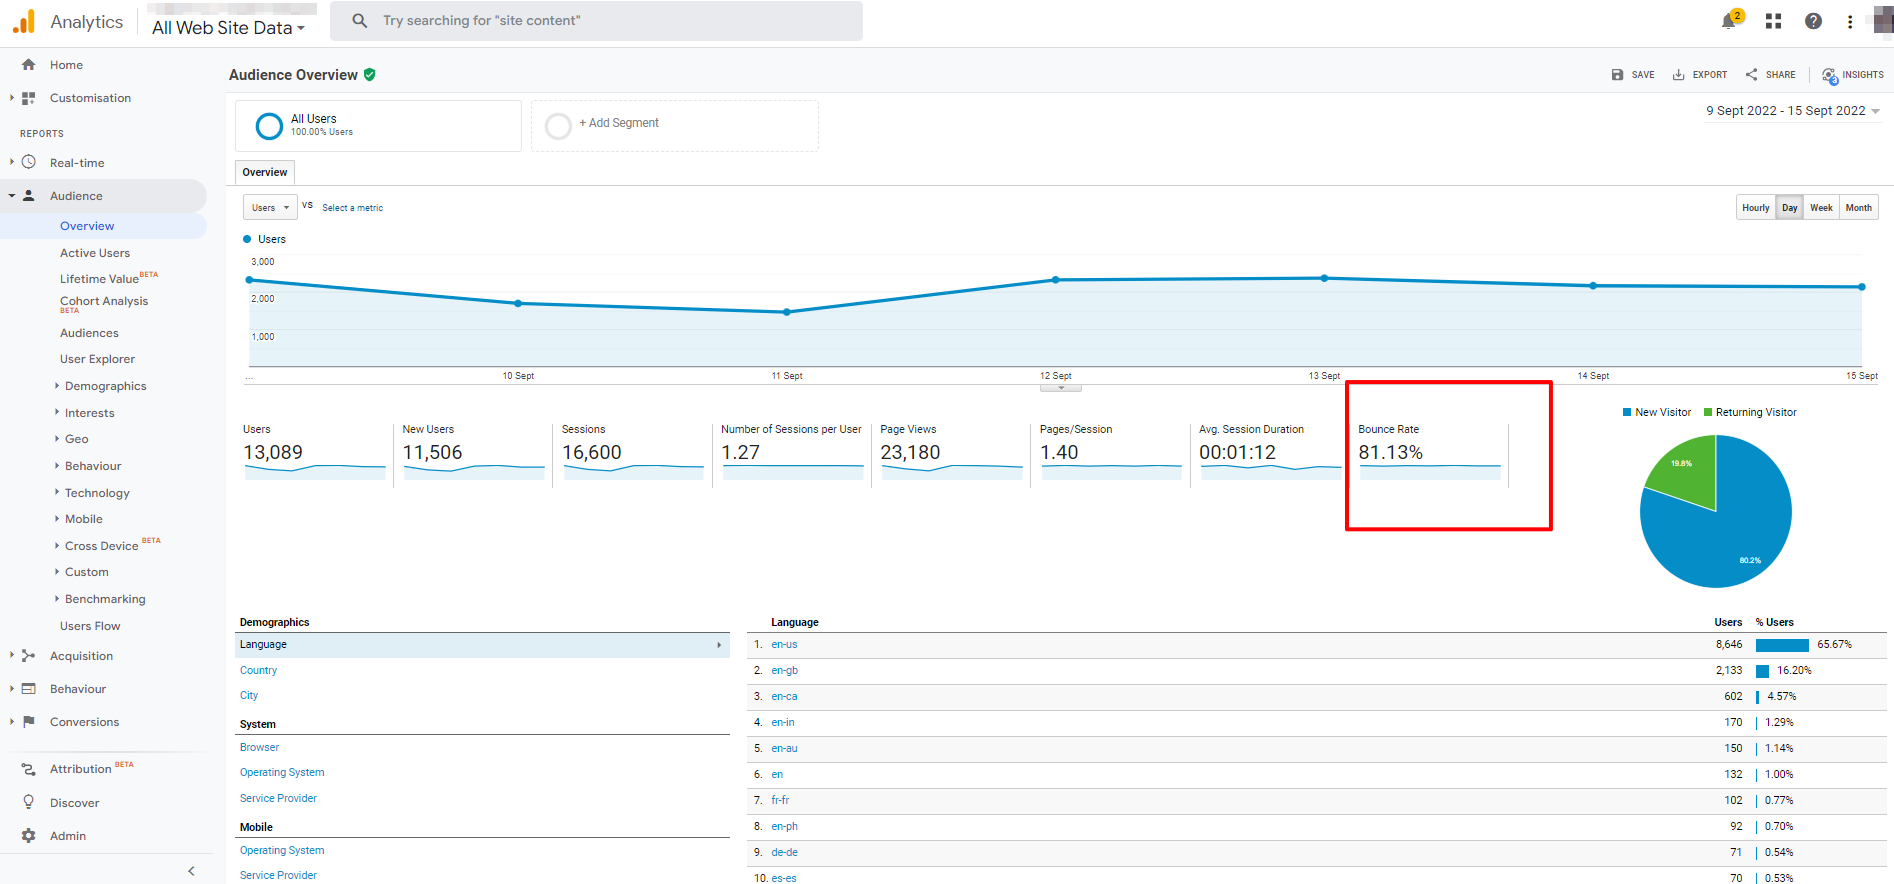
How to measure it:
This is how bounce rates are calculated:
Bounce Rate = Total Number of One-page Visits Divided / Total Number of Entries to a Website
In terms of good versus bad, a high bounce rate isn’t necessarily bad. Depending on different criteria, a good bounce rate and a bad bounce rate can be defined differently. Here is what Google says, for example:
If the success of your site depends on users viewing more than one page, then, yes, a high bounce rate is bad … On the other hand, if you have a single-page site like a blog, or offer other types of content for which single-page sessions are expected, then a high bounce rate is perfectly normal.
In SEMRush‘s opinion, an optimal bounce rate is 26% to 40%. Bounce rates of 56% to 70% are high, though there may be a good reason for this, and 41% to 55% is considered average.
10. Average session duration (or time on page)
What is it:
Average session duration measures how long a user spends on a website, from the moment they arrive to the moment they leave. User time on page measures how much time a user spends on individual pages during a session.
Why does this metric matter:
By illustrating how long users stay on your site, average session duration contributes to the story of user engagement alongside bounce rate and pages per session.
It’s a helpful metric for determining engagement and the true value of your content at the site level (time is money, right?).
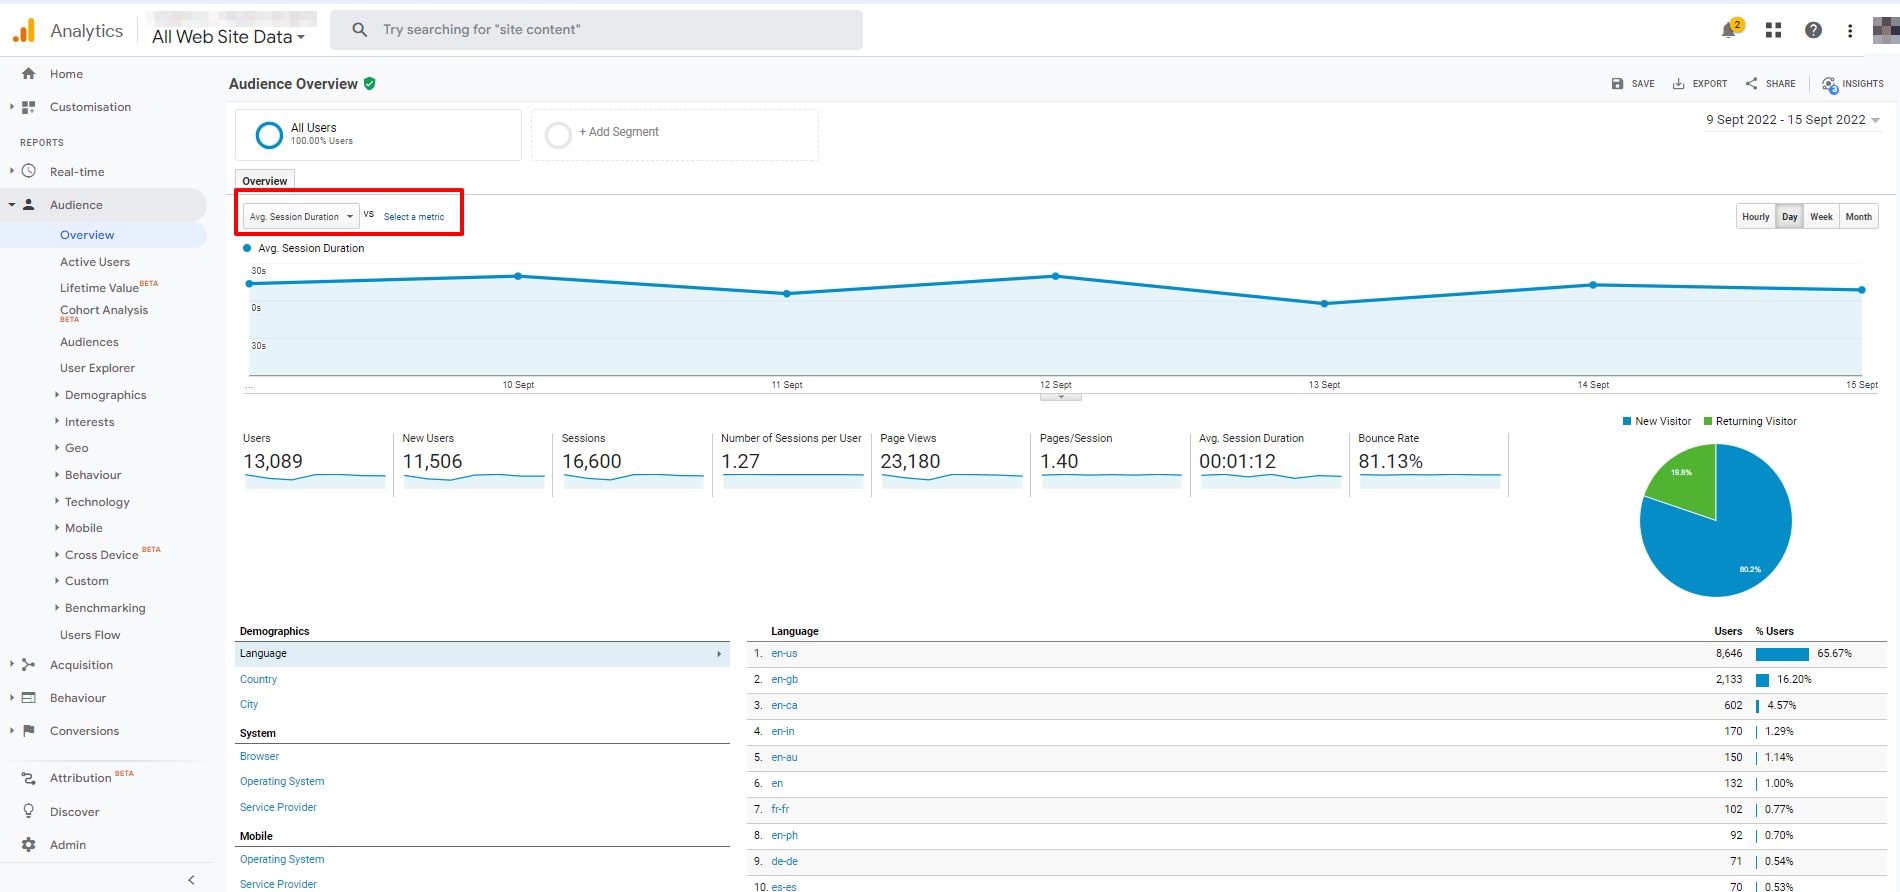
How to measure it:
This formula can be used to determine the average session duration:
Average Session Duration = Total Time Spent Across Sessions / Total Number of Sessions
Databox says a reasonable benchmark for an average session duration is between 2-3 minutes. So, anything over three minutes might be a good average session duration.
For the average time on page, the following formula is used:
Average Time on Page = (Total Time on Page / Total Number of Pageviews) – Number of Exits
Klipfolio reports that 52 seconds is a good benchmark for average time on page across multiple industries.
B2B websites have the highest Average Time On Page of 82 seconds, according to data from 20 billion user sessions.
However, the average time spent on a page is affected by many different factors, such as the type of device used, the type of industry, and the target audience.
11. Average page depth
What is it:
In page depth, users are measured by how many clicks they take to get from the home page to the next.
As an example, if a user lands on your web page, how many clicks does it take to reach your ‘services’ page? The term ‘click depth’ also applies here.
Search engine optimization performance is affected by this because deep pages are less likely to be crawled by Google.
Why does this metric matter:
Using this metric, you can learn about visitor behavior on your site and optimize it with the knowledge you gain.
How to measure it:
The page depth report is calculated by Google in real-time and can be accessed by using the following pattern:
Audience > Behavior > Engagement (at which point you’ll see the report)
While page depth is somewhat subjective, Botify says the best-performing pages usually have a depth of 5 or less.
In other words, if your site has strategic pages with a depth of 1,500, you should reduce that depth.
Performance Metrics
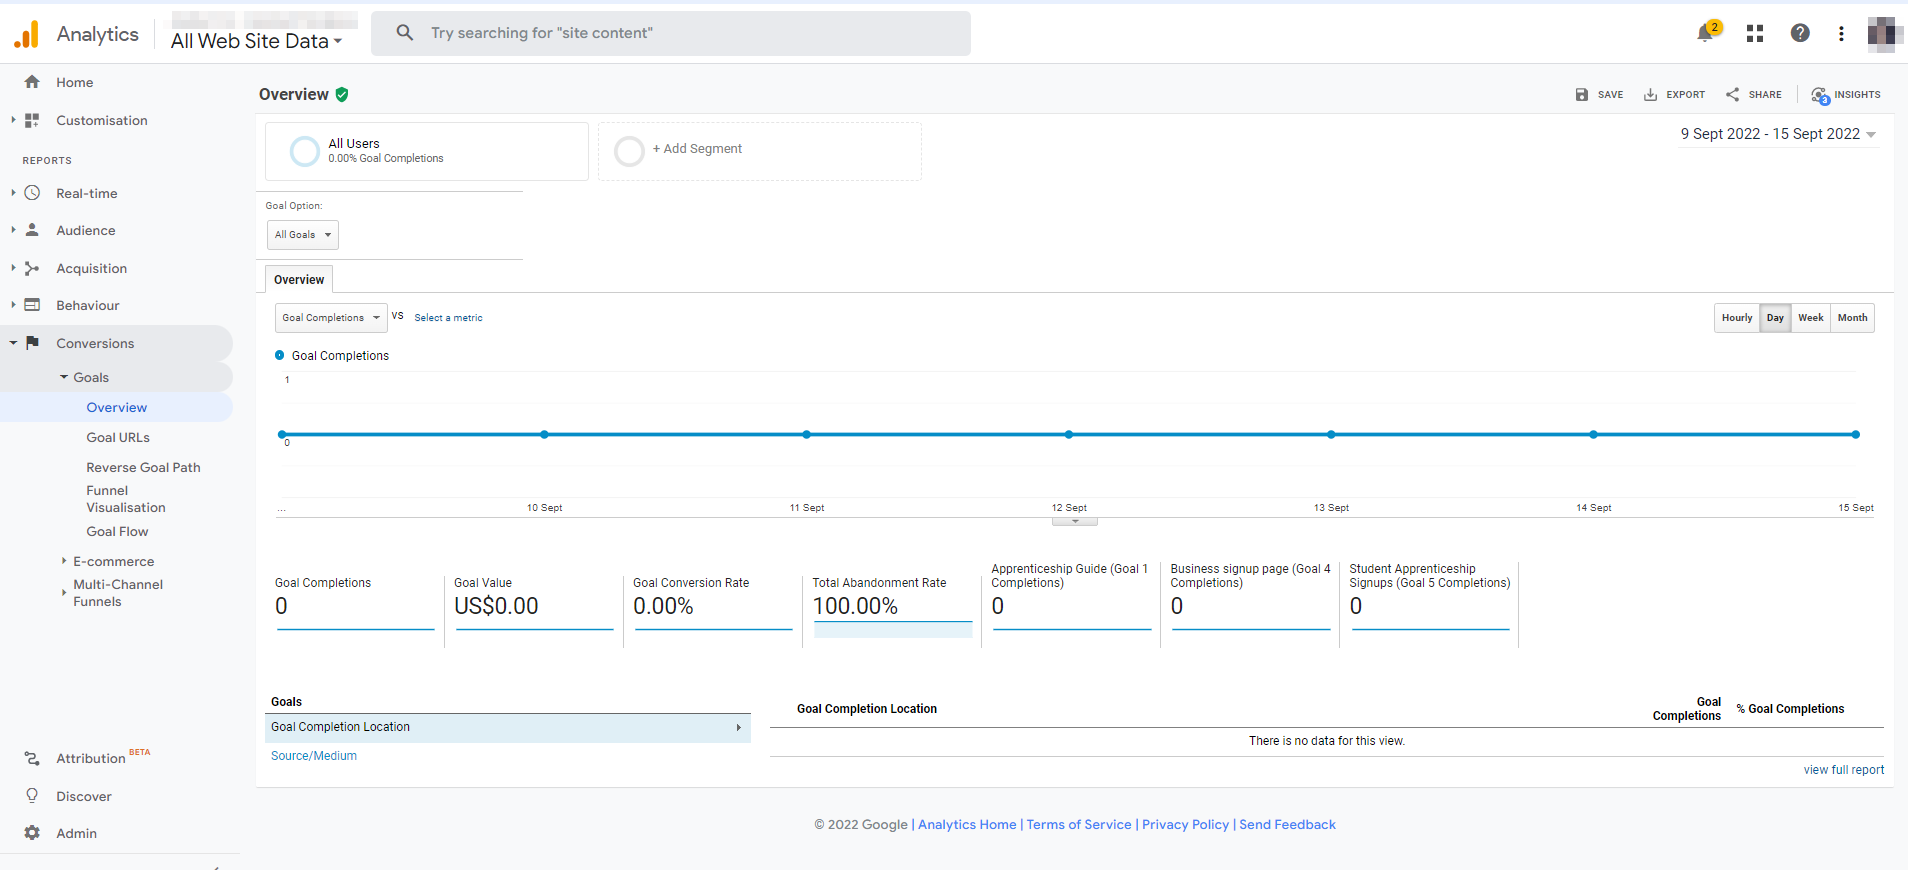
12. Conversion Rate
What is it:
Conversions are defined in Google Analytics as any actions that are valuable for your business.
For example, conversions could include completing your contact form, signing up for your newsletter, or making a purchase.
Why does this metric matter:
By tracking your conversion rate, you will be able to find out how well your website performs in specific areas of interest.
If you have a low goal conversion rate, you are not getting many people to do what you want them to, while a high goal conversion rate means that things are going well for you.
How to measure it:
This is how conversion rates are calculated:
Conversion Rate = Total Number of Goal Completions / Total Number of Sessions
It is important to remember that a goal can only be measured once per session.
This can be navigated on GA4 by following these steps:
Conversions > Goals > Overview
Google Analytics calculates the conversion rate based on all goals you’ve set up.
But if you want an example, WordStream reports that across industries, the average landing page conversion rate is 2.35%, but the top 25% are 5.31% or more.
In an ideal scenario, you would like to break into the top 10% of landing pages with conversion rates of at least 11.45%.
13. Click-Through Rate (CTR)
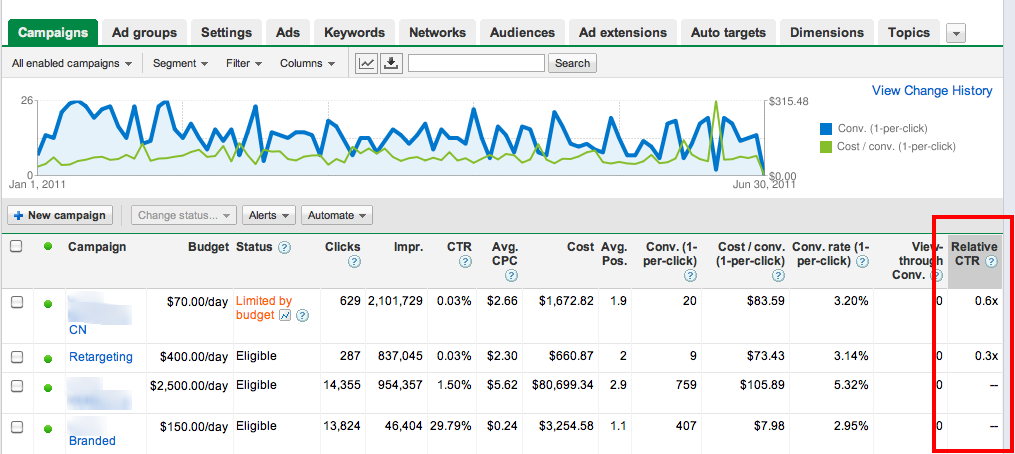
Source: PPC Hero
What is it:
The click-through rate, or CTR, measures the number of clicks advertisers receive on their ads per impression.
Generally, you can view your click-through rate on your PPC account dashboard. If you have a high CTR, that means you are getting a high percentage of clicks on your ad.
Why does this metric matter:
Click-through rate affects Quality Score directly, so it’s important to pay attention to it.
Ads with high relevance (read: making searchers happy) get pricing discounts on Google Ads and other search marketing platforms.
The best way to accomplish this is to give higher Quality Scores to ads that receive high Google Ads click-through rates:
- A high click-through rate leads to a high Quality Score.
- Your ad position can be improved or maintained for lower costs with High-Quality Scores.
Also, achieving a high click-through rate on relevant queries means you’re driving the most people to your business possible.
How to measure it:
A CTR formula looks like this:
Click-Through Rate = [ (Total Clicks on Ad) / (Total Impressions) ] x 100
So, what makes a good click-through rate? From a statistical standpoint, it depends on the campaign, the keywords, the channel, and the purpose of your ad. Even though you want a “high” click-through rate, there really isn’t a magic number.
A click-through rate depends on a variety of factors, including your ad’s position and industry.
14. Cost Per Lead (CPL)
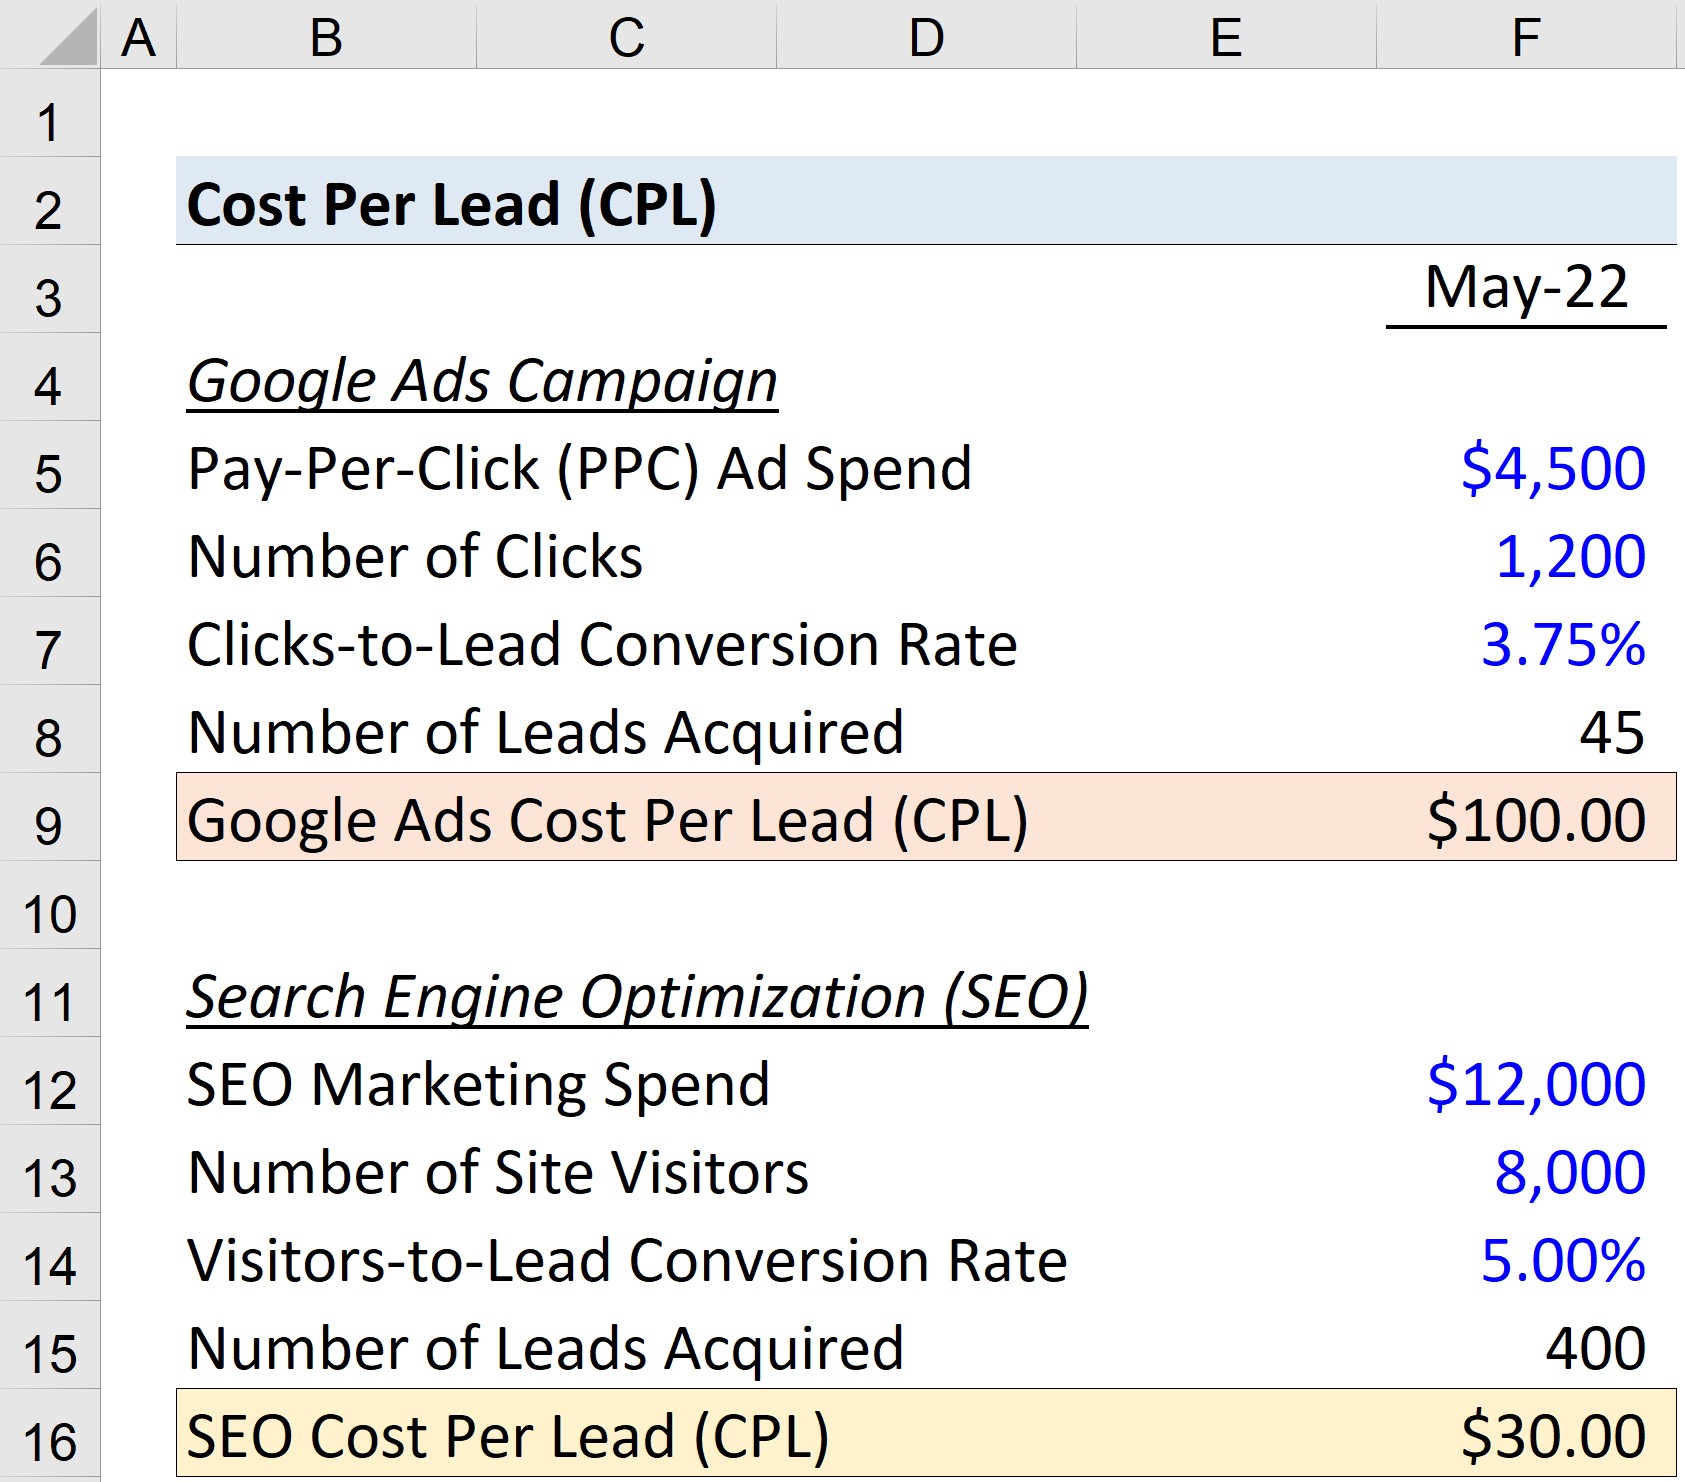
Source: Wall Street Prep
What is it:
A Cost Per Lead (CPL) refers to the cost of generating a new lead for your business.
Depending on the business and industry, lead definitions may differ. However, a lead is typically someone who is interested in your company’s products, but may not be ready to purchase.
Marketing campaigns are measured and monitored using Cost Per Lead. By using it, you will be able to quantify how much it will cost you to acquire new leads, allowing your marketing team to plan accordingly.
CPLs are also essential for calculating the return on marketing investment.
Why does this metric matter:
Understanding your online marketing strategies‘ effectiveness is largely dependent on Cost Per Lead. This will help you determine where you should focus your efforts going forward based on what is working and what isn’t.
Taking a blind guess at your CPL will probably result in you investing in ineffective marketing, or ignoring your successful ones.
How to measure it:
The following formula calculates the Cost Per Lead:
Cost Per Lead = Total Cost of the Campaign / The Number of Lead Generated
A good CPL depends largely on your ideal customer, market, competition, and specific business and industry.
If you want quality, a higher CPL might mean a better lead and a lower acquisition cost. If you’re aiming for quantity, you might want a lower CPL, even if the leads aren’t as good.
15. Cost Per Click (CPC)
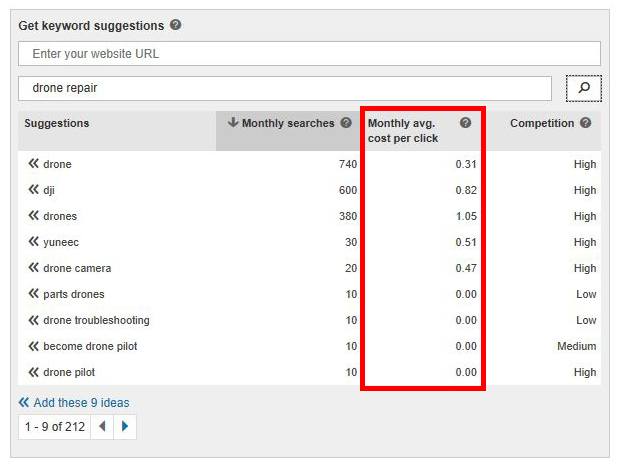
Source: Disruptive Advertising
What is it:
CPC (Cost Per Click) is a term used in paid advertising in which advertisers pay publishers for each click on their ads. PPC (Pay-Per-Click) is another name for CPC.
AdWords, the Google Display Network for AdWords, social media platforms, and other publishers use CPC to determine their costs.
The maximum cost per click is what you think a click is worth and what you want to pay. Depending on the CPC setting, the amount you actually pay may not match the maximum CPC.
For AdWords, Google recommends setting the maximum CPC to $1 if you’re not sure what to choose.
Why does this metric matter:
Marketers should consider CPC because it measures the cost of paid advertising campaigns.
Those clicks, and the costs associated with them, add up fast if you don’t watch your CPC closely. The higher your CPC, the less likely you are to see a return on your advertising investment (ROI).
How to measure it:
Here’s the formula for calculating CPC:
Cost Per Click = Advertising Cost / Number of Clicks
Again, having a low CPC is always a good thing. With a low CPC, you can allow more clicks for your budget, which means more potential leads. You will also earn more money back than you spent, which ensures a high return on investment (ROI).
16. Cost Per Acquisition (CPA)
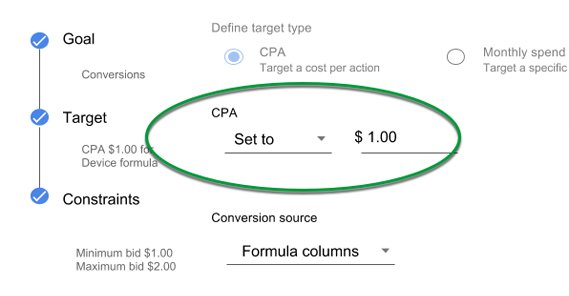
Source: Grow Traffic
What is it:
A cost-per-acquisition metric, also known as a cost-per-action or CPA, measures the cost of converting a customer.
Sometimes, conversions are synonymous with sales, but they can also be clicks, downloads, or installations.
Why does this metric matter:
Marketing professionals should track and measure cost per acquisition (CPA) because it will help you determine whether your strategy needs to be modified based on how much your new customers cost.
Cost per acquisition is used to measure the revenue impact of a marketing campaign, unlike conversion rate, which is an indicator of success.
It is essential for every business, no matter what the industry, to understand the Cost per Acquisition and how to calculate it correctly.
How to measure it:
The mathematical formula for calculating the CPA is:
CPA = Total Cost of a Campaign/Number of Conversions
But, how do you tell if that CPA is good or bad? CPA and CLV are closely related. A CLV (Customer Lifetime Value) represents how much the customer is likely to spend during the lifetime of their relationship with your business.
The reason you want to know your CLV for every customer is so you can determine which channels are most effective for your business, and you don’t overpay for a customer.
Hence, you’ll want to ensure that CLV exceeds CPA for each channel.
17. Return On Investment (ROI)
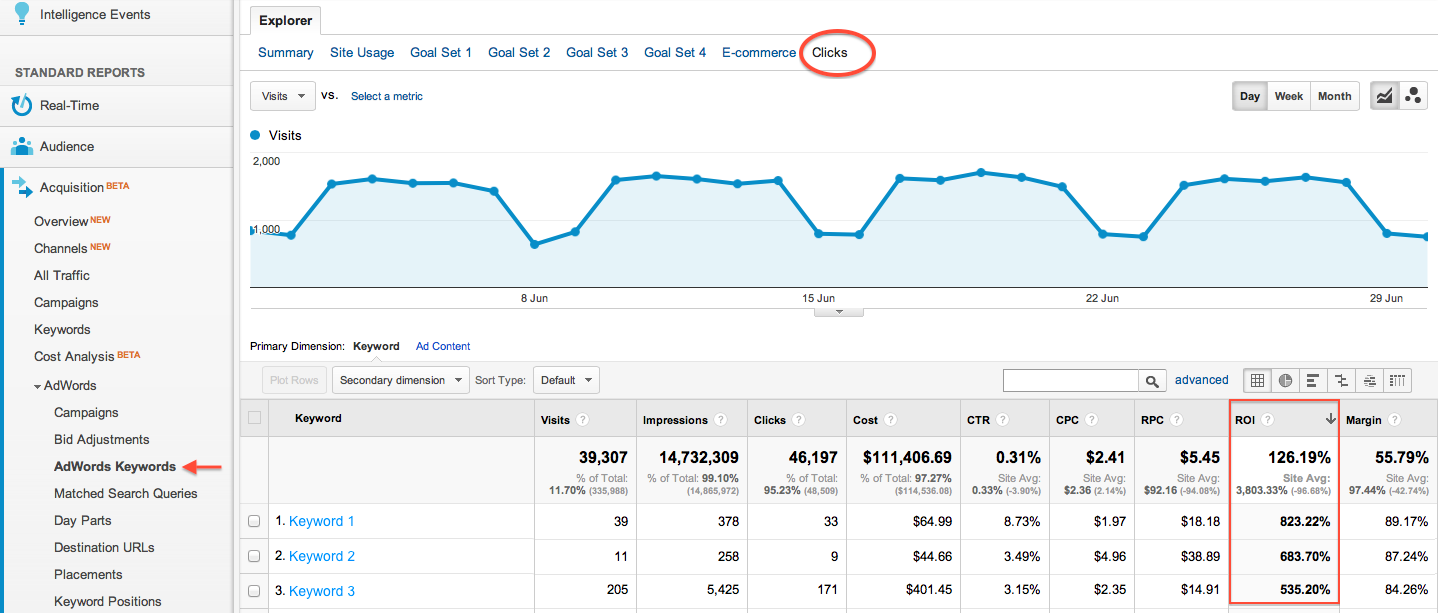
Source: Brian Clifton
What is it:
Marketing ROI refers to the return you receive from marketing investments.
Marketing ROI evaluates how marketing tactics contribute to your business’s profit and revenue growth by attributing profit and revenue growth to marketing tactics.
Alternatively, it is referred to as marketing ROI (MROI) or return on marketing investment (ROMI).
Why does this metric matter:
Measuring marketing ROI provides insight into the effectiveness of your marketing efforts. By defining (with actual numbers) the success of each campaign, you can steer your marketing campaigns in the right direction.
How to measure it:
Follow this formula to calculate your marketing ROI more effectively:
ROI = [(Number of leads x Lead to customer rate x Average sale price) – Cost for marketing] / Cost for marketing
To better process and understand this formula, let’s break it down:
- Number of leads: The number of leads is how many people converted into leads or customers who have already expressed interest in your company.
- Lead-to-customer rate: Lead-to-customer rate is the percentage of leads that became customers. So if 20 leads (out of 100 total leads) become customers, your lead-to-customer rate is 20%.
- Average sale price: The average sale price of your product is the average price of your product. When you calculate the average, you can take into account sale prices and discounts.
- Cost for marketing: The cost of your marketing campaign is the sum of all the expenses associated with it. Your campaign cost may include factors such as ad spend, software, and wages.
An effective ROI depends on the nature of your business. Factors such as your company’s overhead costs, margins, and industry affect your profitability.

89% of leading marketers use strategic metrics to measure the effectiveness of their campaigns.
How to choose the right digital marketing metrics
1. Keep metrics and KPIs separate
Measuring everything means measuring nothing. If you want to separate KPIs from metrics, you need to consider what is most important to your business.
You can use any indicator as a metric, but if it does not provide any useful information to improve, then you should discard it.
Wrong metrics can also lead to a waste of time and resources. Taking too many measurements can lead to confusion and misinterpretation.
Make sure you select only the digital marketing metrics and key performance indicators that really add value to your goals.
2. Apply the SMARTER and Six A’s methods.
The acronym SMARTER stands for Specific, Measurable, Attainable, Relevant, Time-bound, Evaluate, and Reevaluate. You can think of it as a list of requirements that your marketing metrics must meet in order to be considered useful.
Ideally, they should be specific to your goals, realistic to your business reality, and flexible to change as your business evolves.
Alternatively, the Six A’s stand for Aligned, Attainable, Acute, Accurate, Actionable, and Alive.
Similar to the SMARTER criteria, this practice evaluates the relevance of metrics and is useful for businesses that have too many indicators and need to narrow them down.
Applying these methods should allow you to narrow your digital marketing metrics down to around two to five key marketing metrics per business goal.
It also allows you to keep your analysis process specific and avoid misleading information that could affect your data interpretation.
3. Don’t get caught up in vanity metrics
A vanity metric is an indicator that appears good on paper but is not useful for planning future business strategies.
A vanity metric may be used to demonstrate improvement, but in reality, they aren’t actionable or related to anything significant.
A good example of a vanity metric is social media followers. Imagine you implemented a campaign that attracted 10, 000 new Instagram followers.
This might seem like a success at first, but if only 50 of those 10,000 followers actually purchase your product or service, then the metric is meaningless.
If you want to avoid vanity metrics, be as objective as possible. When choosing marketing metrics to monitor, make sure they reflect the truth. Likes and followers might seem exciting, but they can also lead you astray.
4. Set realistic goals
Lastly, setting achievable targets is a key component of measuring metrics correctly. To effectively measure metrics, you must know where you are headed and what your targets are.
In this case, you should avoid setting unrealistic targets, such as a 50% increase in sales when your average increase in previous years has been 5%.
In setting targets, consider your business context as well as some industry benchmarks. When you set realistic values, you will avoid getting stacked or disappointed by setting unattainable goals.
Let an apprentice help you manage your digital marketing campaigns
As a business owner, it’s important to have a good handle on all the marketing analytics along with the latest digital marketing trends and techniques. But sometimes, trying to stay on top of everything can be overwhelming. That’s where an apprentice comes in.
By delegating some of the day-to-day tasks to an apprentice, you can free up your time to focus on more strategic work. And, since apprentices are typically eager to learn, they can be a great source of new ideas and fresh perspectives.
While an apprentice may not have the same level of experience as a more experienced digital marketer, they can still be a valuable asset to your team. And, if you take the time to mentor them, you can help them develop the skills they need to become a successful digital marketer.
The Acadium digital marketing apprenticeship program is a great way for both your company and aspiring digital marketers to grow together.
You’ll find candidates with the skills you need, as well as those who are ambitious enough to help scale up your business while they sharpen their abilities under your guidance.
Your marketing apprentice will work with you for 10 hours per week for three months straight in exchange for 1-2 hours of mentoring.
Plus with Acadium’s vetted matching system, you don’t have to go on a hiring spree or interview and train people in person. Simply submit a match request and you’ll be connected with the best marketing talent right away.
Sounds good? Then sign up for an Acadium business account today and discover how to maximize your apprentice’s potential while growing your business.
Princess “Ji” Kang is a staff content writer at Acadium who unveils complicated topics about digital marketing. She's been wordsmithing for various brands and industries for nearly 6 years, after earning her Master's Degree in English Language and Literature along with her Digital Marketing certification. Her work has appeared on sites such as asksebby.com, wellpetcoach.com, Ready Home Singapore, ThePerfectMedia Group, and more. You can find her at her home mini-library reading, sipping hot coffee, or playing with her cats in her downtime.
-
Business Growth
Build a Real Marketing Plan Using AI This Afternoon (Not This Quarter)
-
 Business Growth, Career Prep
What is an SEO landing page & How to Build One? [Step-by-Step Guide]
Learn the ins and outs of SEO landing pages and how to build one with our step-by-step guide. Discover the key elements and best practices for creating a high-performing landing page that drives conversions and improves your search engine rankings.

Subscribe to our newsletter for digital marketing resources
Become a better marketer with our digital marketing resources and tips shared weekly in your inbox.

Get started with Acadium
Build your marketing career for free or find marketing talent on any budget — fully remote.